It now appears we may be headed into our second consecutive La Niña winter. We discuss the forecast, remind you what La Niña actually is, and explain potential impacts on Colorado for this winter.
Earlier in the year, it was projected that the Northern Hemisphere would either see a neutral or El Niño 2017-18 winter season. That forecast has now been throw out the window, which isn’t all that surprising. During the spring months, climate models have notoriously low skill at predicting the phase of the El Niño Southern Oscillation (ENSO) for the upcoming winter. Complicated physical interactions during the late spring and summer months within the equatorial Pacific Ocean are consistently beyond the modeling capabilities of scientists at the moment.
Now that we are just a few months from winter, forecast skill is much higher.
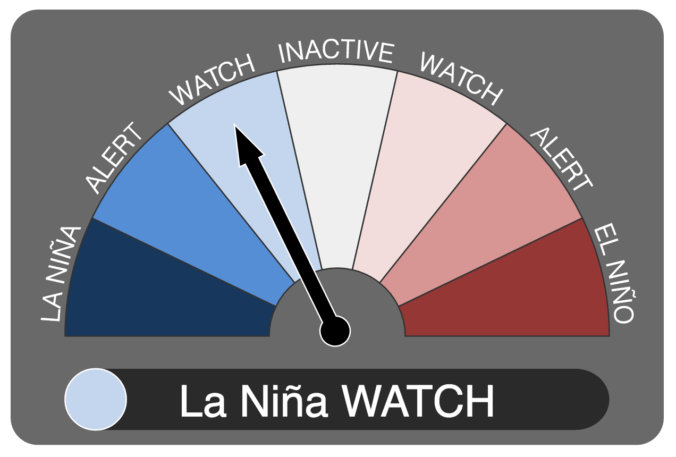
As of late September, NOAA has issued a “La Niña Watch” for the upcoming winter.
Forecasts indicate that there is approximately a 65% chance of a La Niña taking hold by early December. The remaining 35% of forecasts are for an ENSO-Neutral winter, leaving 0% for our beloved El Niño!
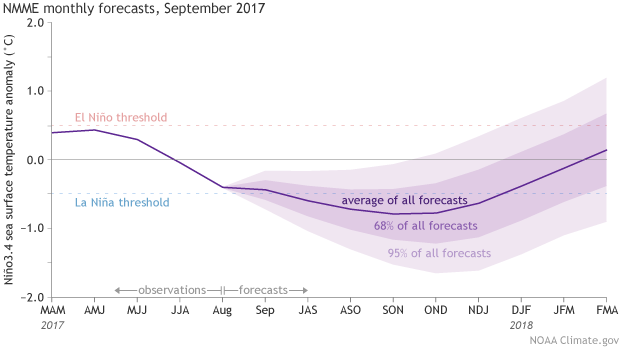
NMME (NCEP ensemble) forecast for ENSO through Spring 2018.
What is La Niña?
La Niña is associated with cooler than normal ocean temperatures in the central and eastern tropical Pacific Ocean, with enhanced easterly trade winds along the equator and a shift of the warmest waters westward in the Pacific.
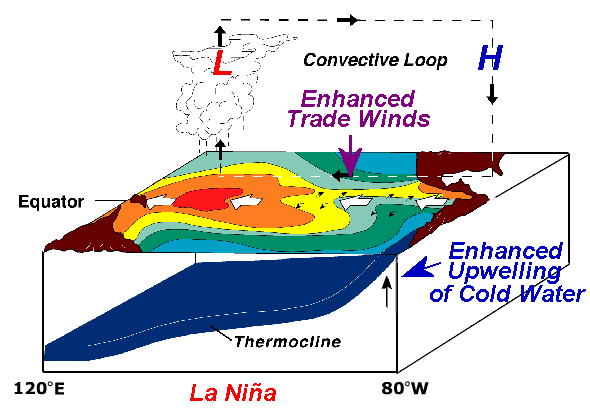
Large-scale upward motion in the atmosphere and the resulting thunderstorm development along the Equator follows the warm pool of ocean water westward. This creates a convective loop across the Pacific (shown above). These are just the localized effects of La Niña. Our atmosphere and ocean are intimately coupled on a global scale. This leads to locations all around the world, including Colorado, being influenced by ENSO.
Tracking La Niña
To keep eyes on ENSO, researchers have deployed large arrays of buoys throughout the Pacific to monitor ocean temperatures at the surface and deep below. The most widely accepted/correlated temperature measurements come out of a region known as Niño 3.4 (shown below). From these measurements, the Oceanic Niño Index (ONI) is used to determine the current state of ENSO, with an ONI > 0.45 (warm anomaly) indicating an El Niño , an ONI < -0.45 (cold anomaly) categorized as La Niña, and an ONI in between coined as ENSO-Neutral.
The 3.4 Niño region in the Pacific Ocean. This area is heavily monitored by scientists in order to keep tabs on ENSO.
The table below shows the ONI index for each month in the last 7+ years. Two winters ago was the strongest El Niño in history, and last year, we endured a weak La Niña.
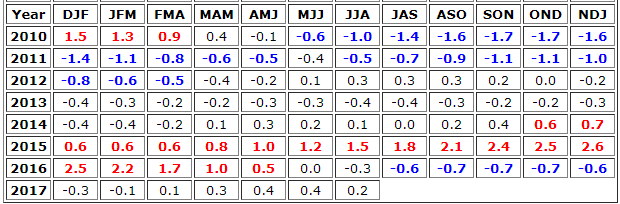
The current ONI index is -0.2 degrees Celsius and waters continue to cool in the eastern tropical Pacific Ocean. The graphs below of temperature anomalies show the growth of the cooling below the ocean’s surface since August 6, 2017. Essentially a time-lapse of La Niña being born!
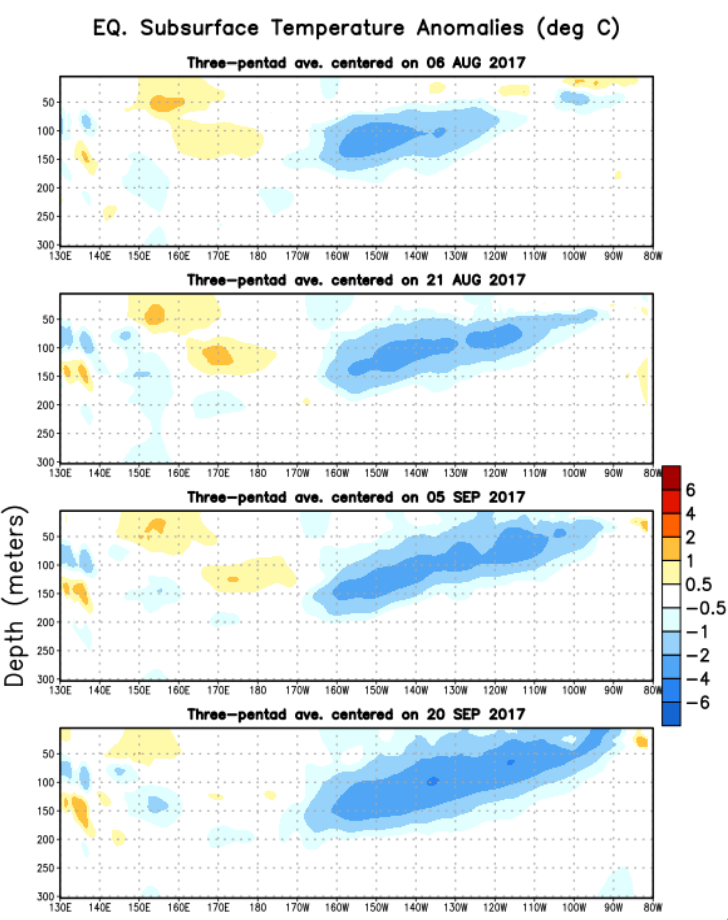
You may be having trouble visualizing what the graphs above physically represent. I found this animation from NOAA fairly useful for putting things into perspective! The data in the animation ends on September 5th, however.
The main take-away here is the it looks probable that Mother Nature is pulling us into another La Niña before the end of 2017.
So what does this mean for the first half of winter in northeast Colorado?
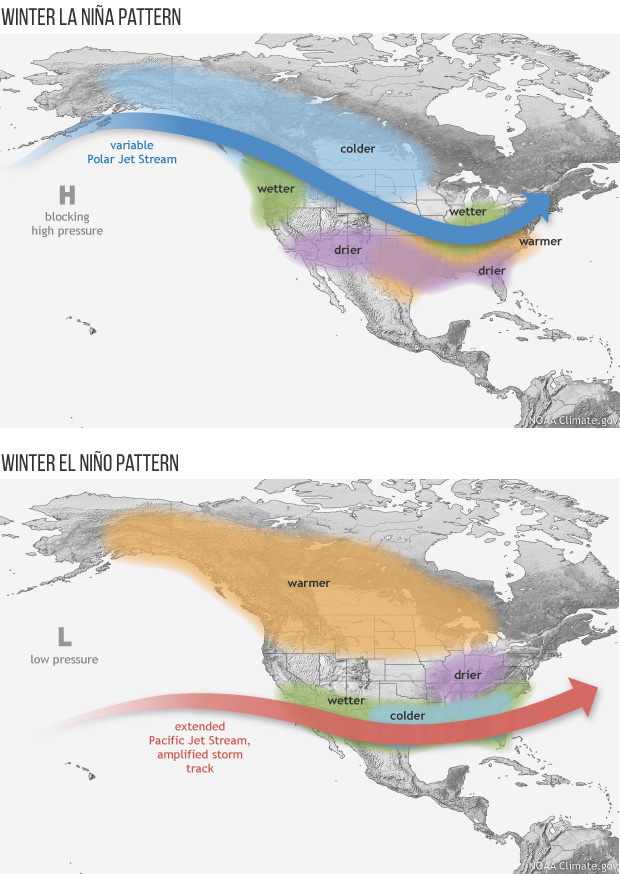
The (admittedly oversimplified) diagram below shows the general conditions during the positive and negative phases of ENSO across North America. A “typical” La Niña winter sees the jet stream keep a more northwesterly orientation across Colorado (top diagram below). Most of our storms will therefore be the cold and relatively dry Canadian variety. This is opposed to the juicy and comparatively warm storms that are a staple of El Niño winters for the Front Range. This jet position also produces orographic snows for the Mountains favored by northwest flow (those near Steamboat).
Let’s look at actual data.
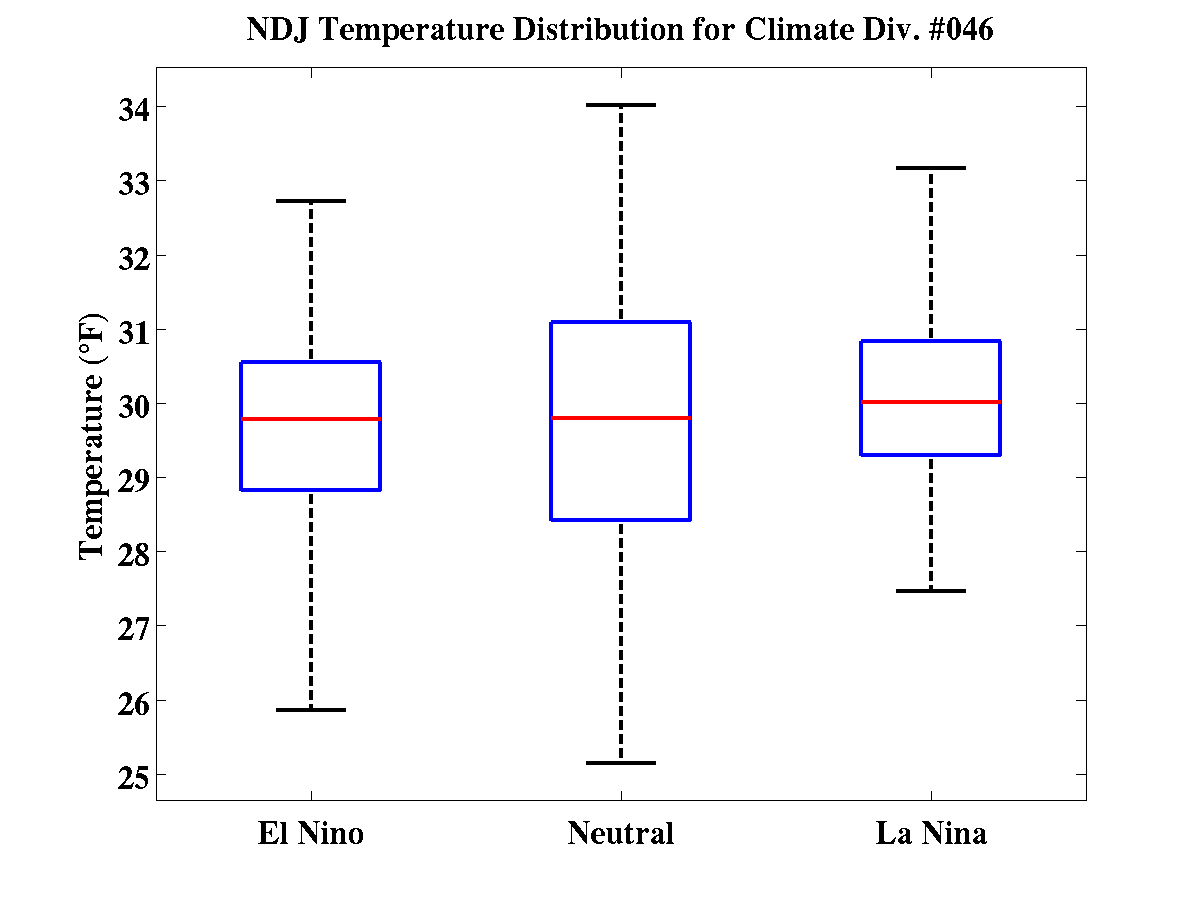
Based on temperature and precipitation analysis from the Climate Prediction Center, the early winter period (NOV/DEC/JAN ) under La Niña has little discernible differences from other ENSO patterns for all of northeast Colorado (Climate Division #46).
The graphs below are called box-and-whisker plots. The red lines indicate the median value….the blue boxes contain 50% of all years….while the “whiskers” capture the more extreme years.
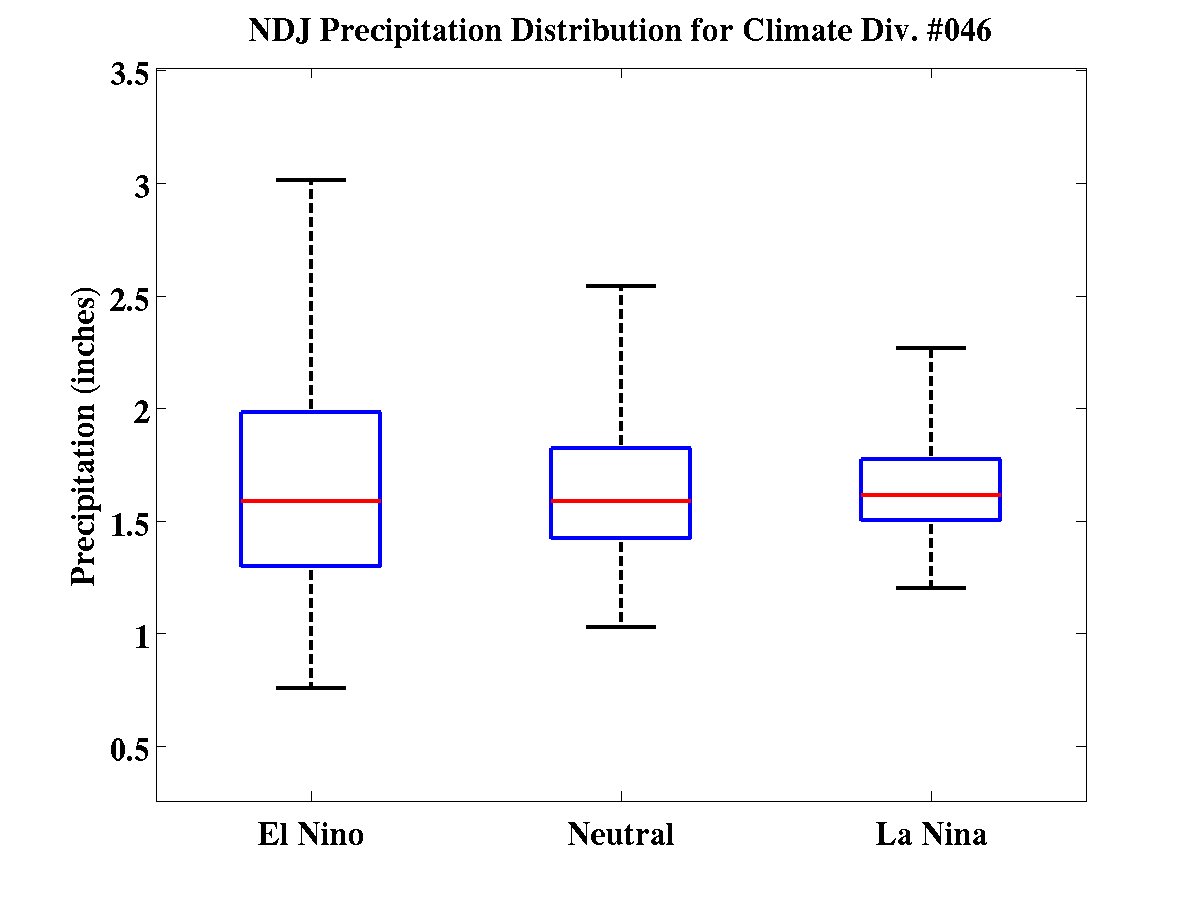
The one noticeable difference is in precipitation (snowfall). The variability compared to neutral winters, and especially El Niño winters, is greatly reduced. This is seen by decreased “whisker” length and is largely due to the lack of intense southern storms that tap into Gulf of Mexico moisture. These big events tend to make-or-break El Niño winters and can be highly variable.
Here are some of the highlights to look forward to this winter:
- Big snow storms are less frequent during La Niña in Boulder County. Since 1950 in Boulder, only 5 out of 28 (18%) snow storms dropping at least 15 inches in the city occurred during La Niña years, relative to neutral or El Niño years. Furthermore, none of our top 10 biggest snow storms on record came during La Niña years. Insert sad face here.
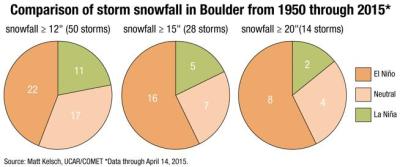
From the Boulder Daily Camera. Color selection for diagrams is apparently not their strongest skill set…
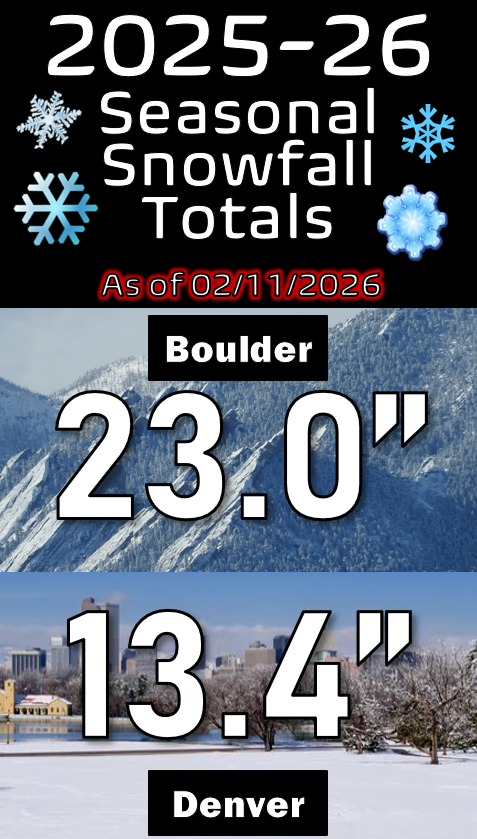
- However, there is no correlation between ENSO and total seasonal snowfall in the Front Range mountains or Plains. The less frequent big dumpings are replaced with relatively more frequent small snows during La Niña. During last winter’s weak La Niña, Boulder observed only one 12″+ snowstorm and received just 62″ of snow (normal is 85″). It literally pains us as meteorologists to point out that Denver only saw 22″, the second lowest total all-time.
- There is also no significant correlation between La Niña and temperature for Boulder County, but there is more overall wintertime cold outbreaks and downslope wind storms for the Foothills and Plains.
The temperature and precipitation seasonal outlook from the Climate Prediction Center for October through December is below. We can’t find any reasons to disagree with their outlook for Colorado in general. Warm and normal precipitation seems about right.
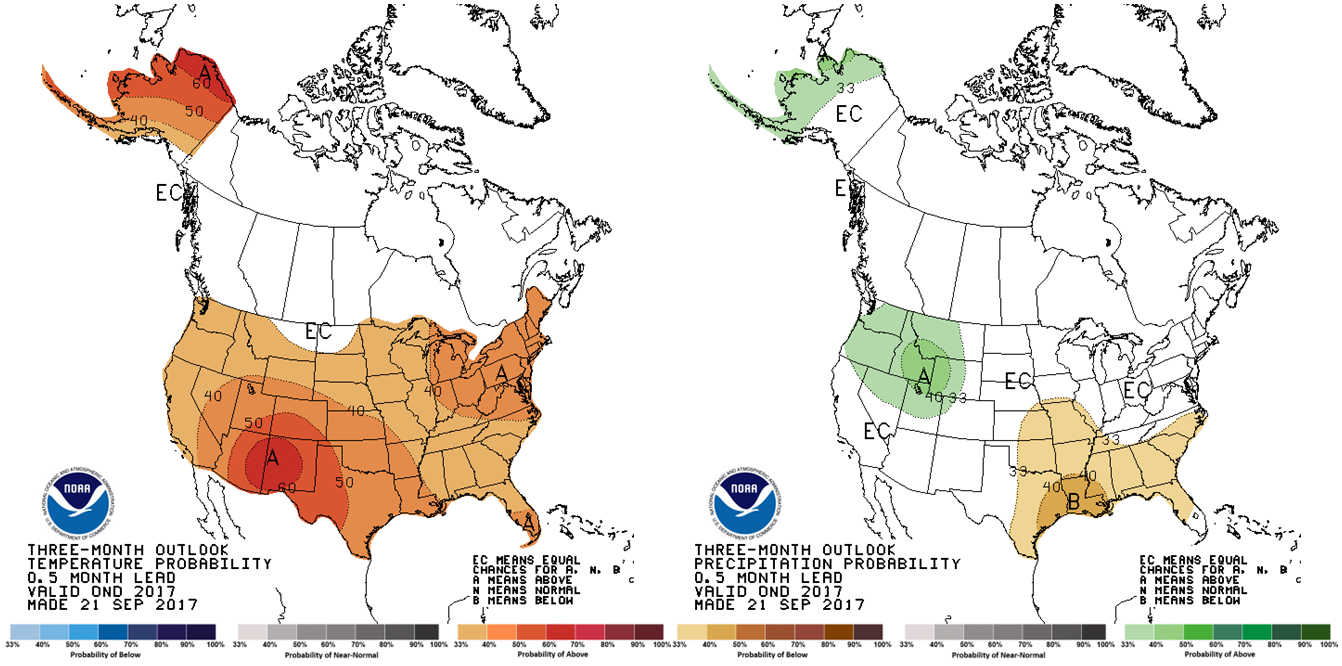
Oct/Nov/Dec temperature (left) and precipitation (right) outlook | Climate Prediction Center
In summary:
- A weak La Niña is projected to develop over the next 60 days and linger through a chunk of the upcoming winter
- For October/November/December, the Climate Prediction Center forecasts increased odds of above normal temperatures. We concur.
- Precipitation should be near normal through January with semi-frequent smaller snow events (think 2-6″) and few, if any, storms exceeding 10″ of snow.
- Expect more-than-normal cold snaps and downslope wind storms this winter
Keep in mind that even the mentioned correlations are quite low for our region. The “randomness” of Earth’s complicated weather from year-to-year is much more dominating on our weather than ENSO could ever be. Let’s hope we can at least out-do the warm and snow-deprived disappointment that we all felt last winter…
Enjoy this content? Please share it with your friends!
.


You must be logged in to post a comment.