With El Niño now in full-swing, we run the numbers to see what type of impact we could potentially see in Boulder as the summer monsoon continues.
ENSO Forecast Update
Last time we checked in on El Niño, it was weak, but the forecast consensus was for strengthening through summer and into the fall. So far, through mid-July, this forecast has been spot on. Shown below is an animated map of the Pacific sea-surface temperature (SST) anomalies, from April 15 to July 1, 2015.
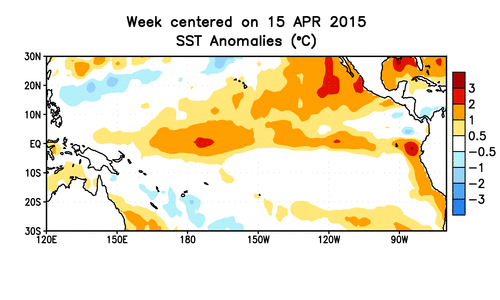 The greatest departures from normal are right along the South American coastline, extending west along the Equator, the signature of a conventional El Niño. Notice the increased warming, particularly during the month of June. The Oceanic Niño Index (ONI) is shown below for the last year.
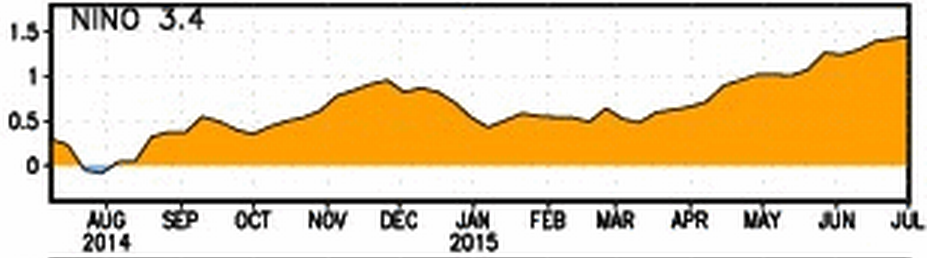
Notice the perpetual strengthening of El Niño, beginning in April, and the current ONI of +1.4 degrees Celsius. It is safe to say we are now in a moderate El Niño. Looking forward, the climate model projections (shown below) concur on further strengthening, with the ensemble mean nearly reaching an ONI of +2.0 degrees Celsius by November.
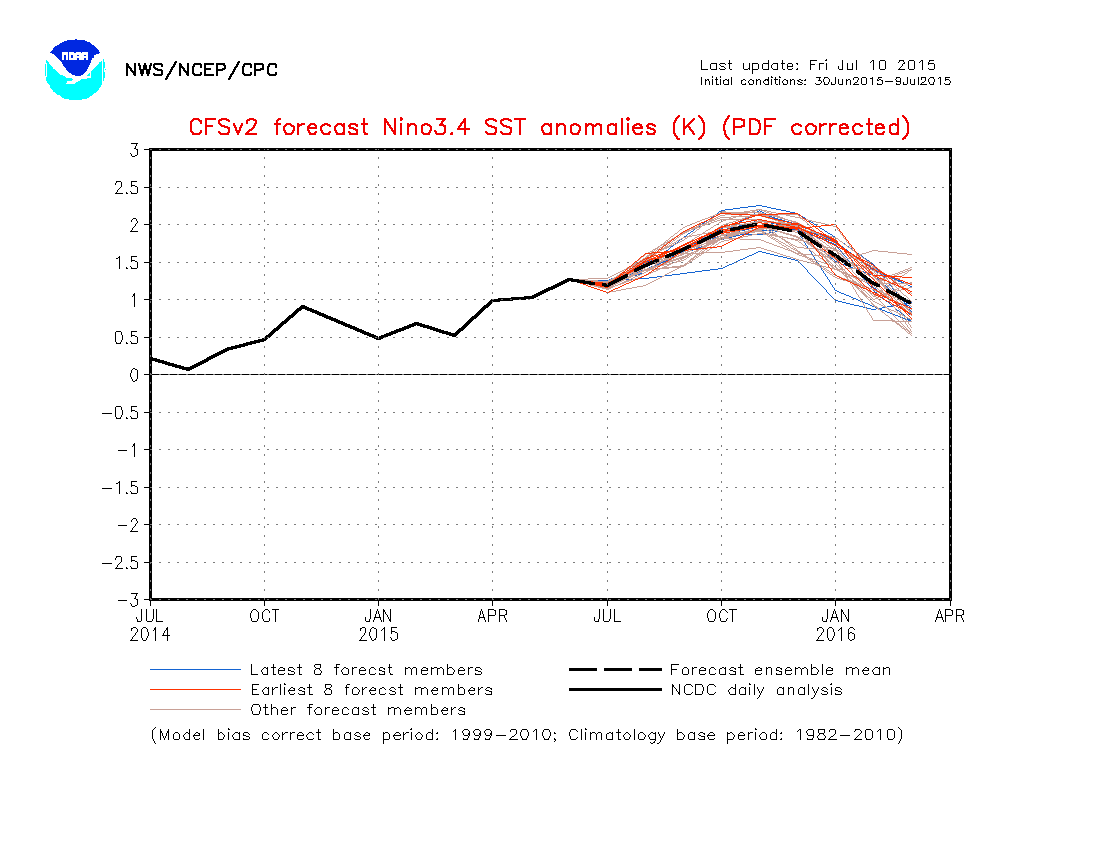 If this forecast verifies, 2015 could make it into the top three strongest El Niños in the last 65 years, joining 1982 and 1997. At the very least, the moderate El Niño will stay through the summer, and likely into early 2016.
By the Numbers
Monsoon season in northeast Colorado typically starts in early July and persists until the latter part of August. Of course, the exact start date, end date, and length of our monsoon season are highly variable. With all of the recent rain, we can definitely confirm that the monsoon season has commenced. Boulder has quietly recorded rain on 9 of the first 10 days of July, totaling to 2.14″ for the month, already surpassing the full monthly average of 1.8″! With the presence of an El Niño confirmed and likely to persist through at least September, what can Boulder expect in the way of precipitation and temperature, given these conditions?
The figure below shows box-and-whisker plots of precipitation for Boulder for the monthly totals of July, August, and September. The black box-and-whiskers contain monthly rainfall totals for all years, stretching back to 1950. The light blue plots show only the months for years where El Niños were occurring, while the dark blue plots only represent months where moderate (or stronger) El Niños were present. The numbers at the top of the figure indicate how many years those particular conditions were present (data from official Boulder climate site at NOAA)
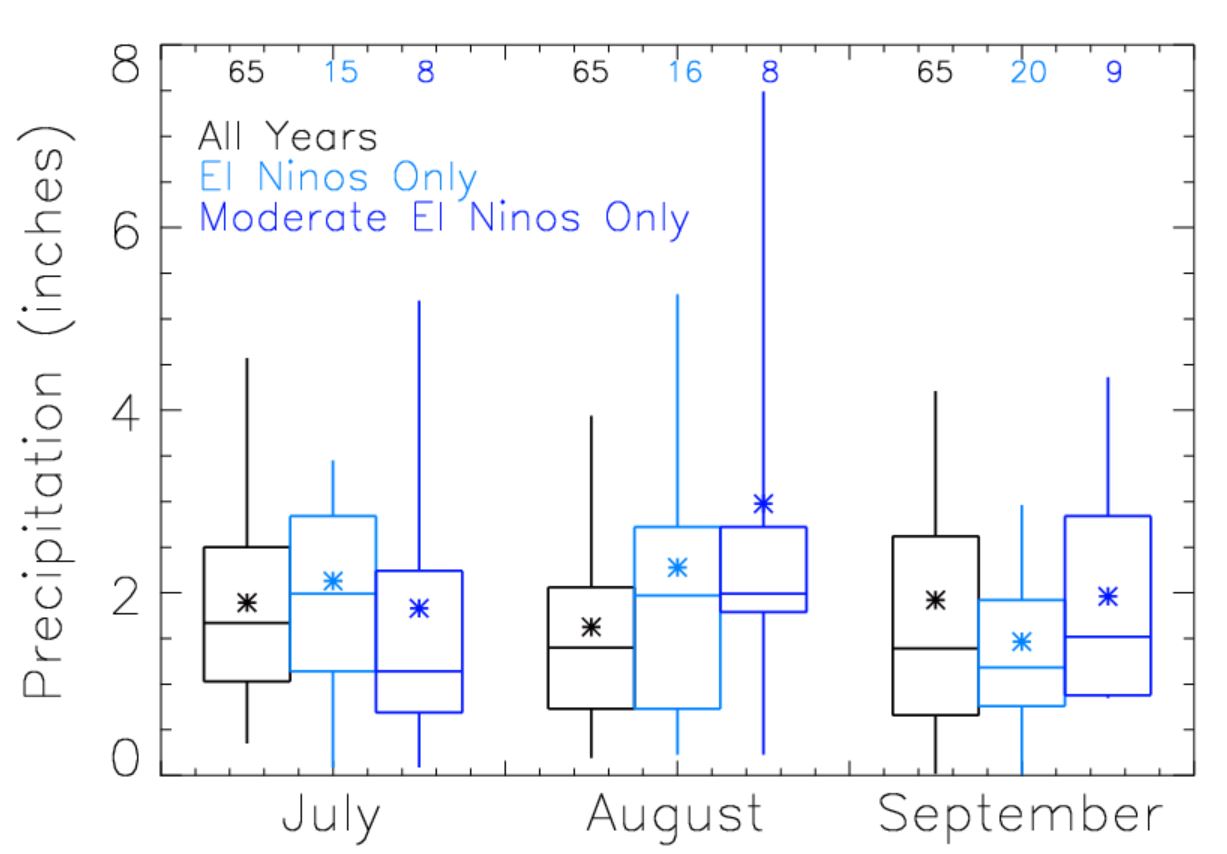 Notice that under El Niño conditions, both the mean and median precipitation in Boulder increases compared to average (light blue vs. black) in July and August, while September actually sees less precipitation during El Niño events. (NOTE: Since the number of El Niño years are relatively small, the median is more representative than the mean for those data sets). Under moderate El Niño conditions, the precipitation signal in July is closer to normal, or even reversed (less precip during moderate El Niño). However, in August, moderate El Niños bring more rain than weaker El Niños, while in September, a moderate El Niño shows a slightly (though statistically insignificant) increase over average conditions.
A completely analogous plot for Boulder’s mean monthly temperatures are shown below.
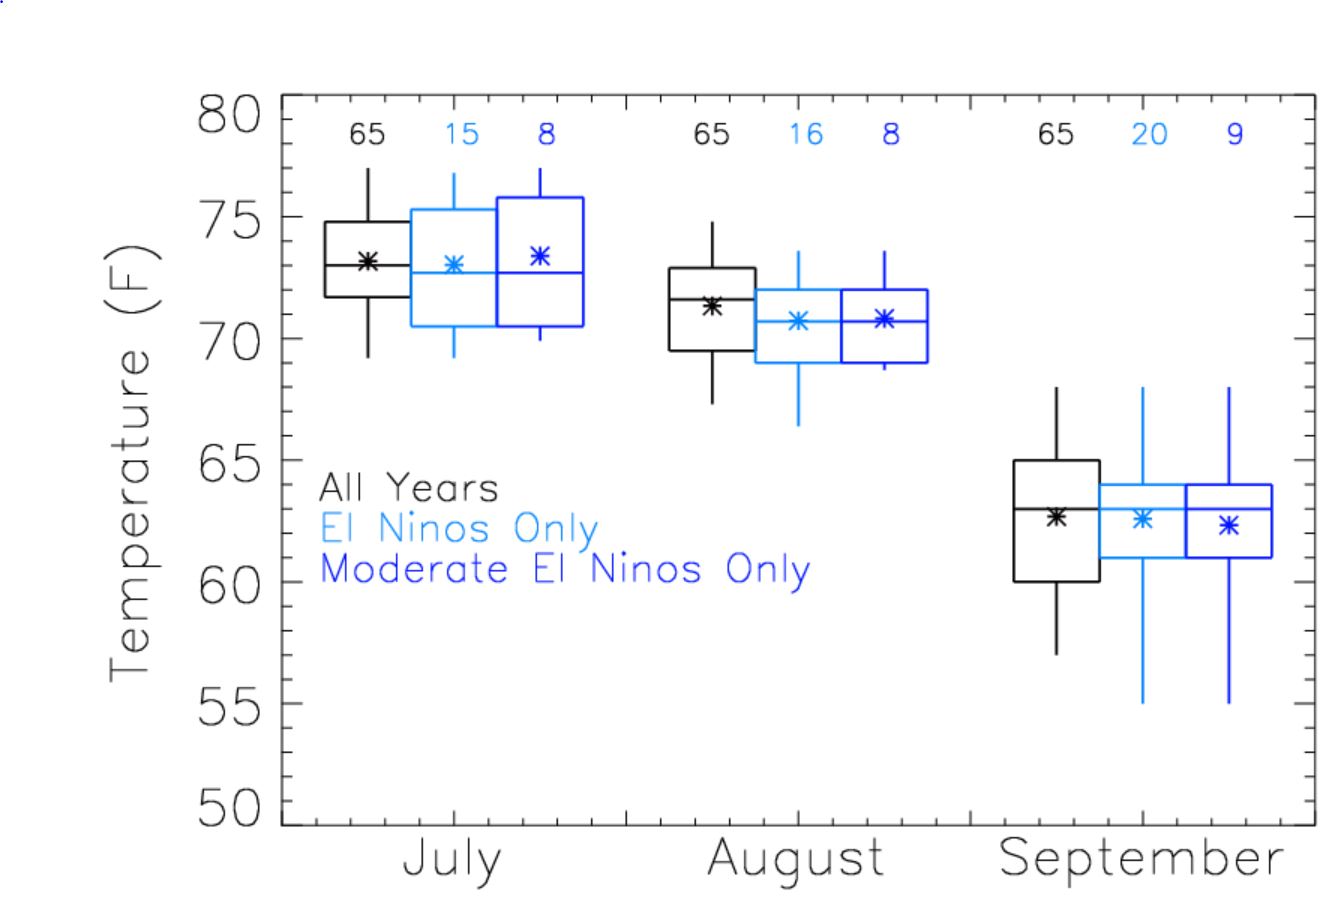 El Niño has a slight net cooling effect for Boulder in both July and August, regardless of the strength. In September, the effect is less pronounced, but ever-so-slightly present as well. This cooling is associated with the increased clouds and rainfall that accompany the enhanced monsoon during El Niño, limiting the amount of daily afternoon solar heating. The plot below confirms this. While the plot above described mean monthly (overall) temperature, the figure below describes mean monthly high and low temperatures.
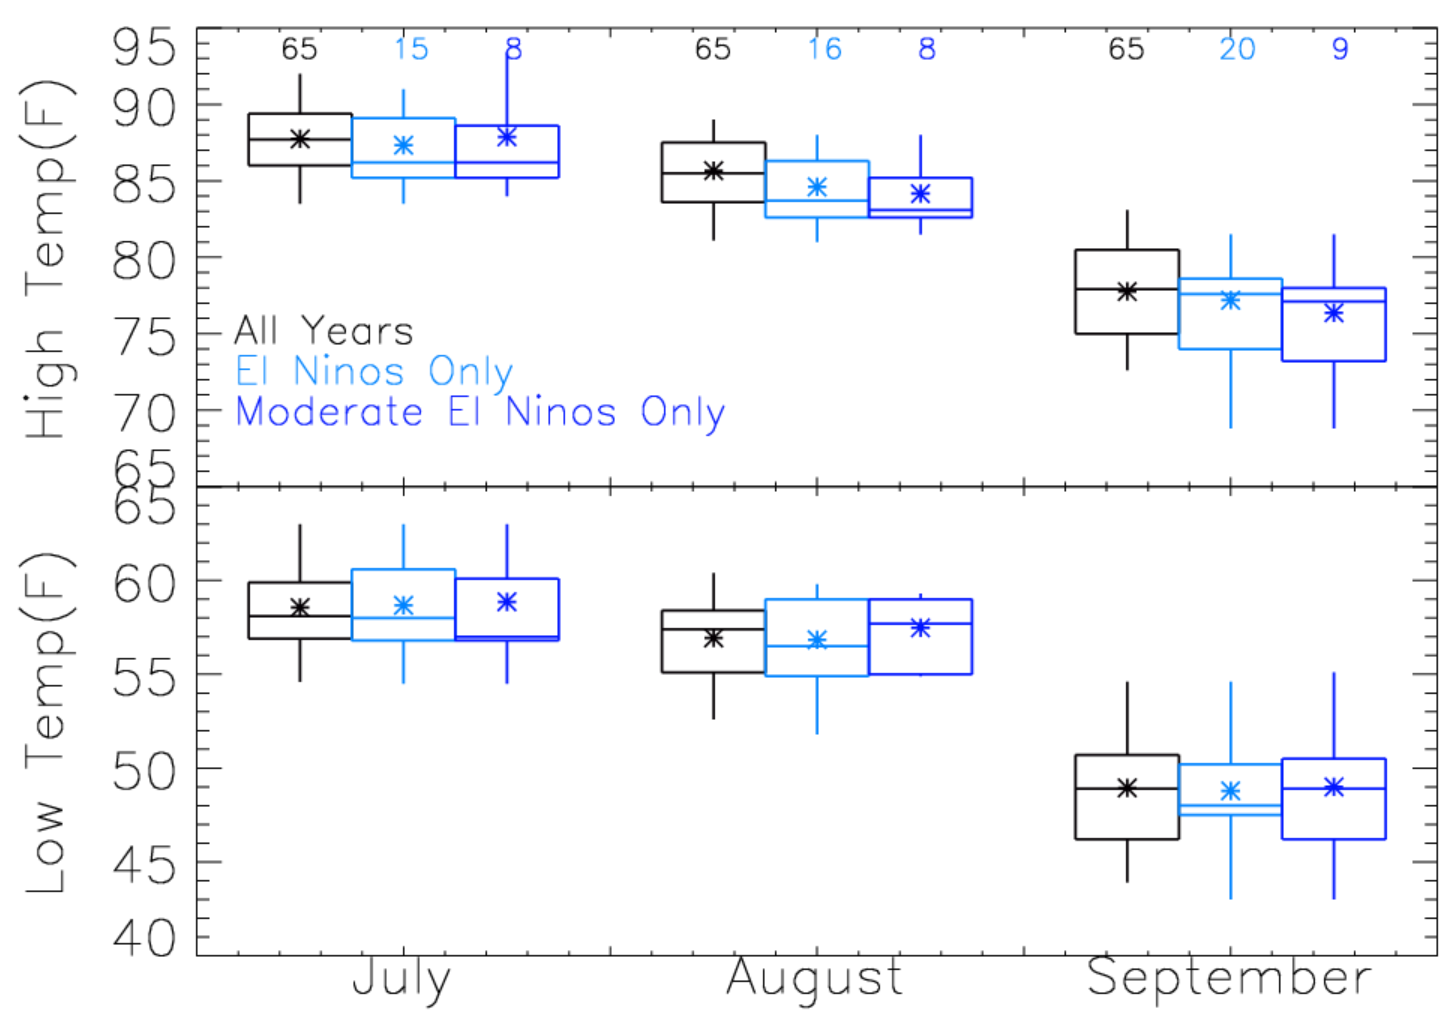
The most notable cooling during El Niño is visible in the daytime high temperatures of July and August, and to some degree, September. The cooling is reduced for the overnight low temperatures, and slight warming is even seen for moderate El Niños. This is because monsoon clouds and moisture actually have the opposite radiative effect at night, acting as a blanket for the ground, providing warming by increasing the amount downward infrared radiation.
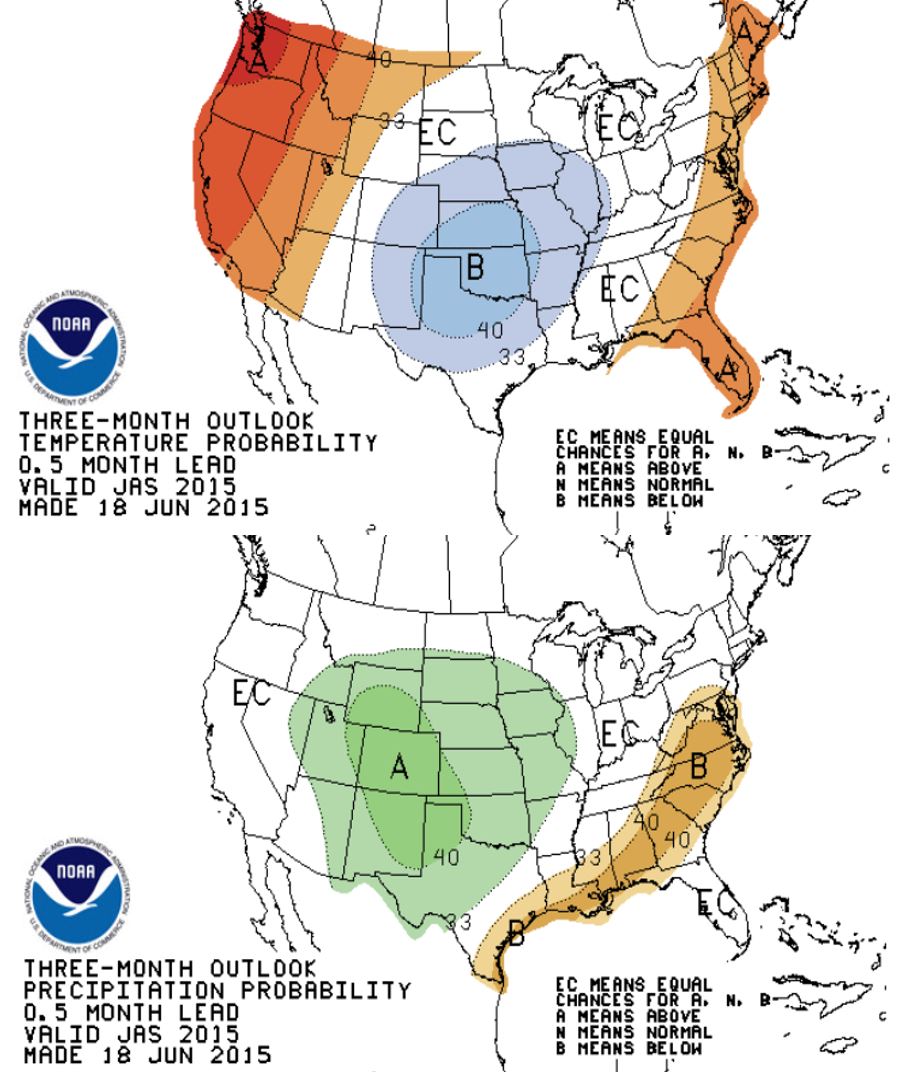
The NOAA Climate Prediction Center is following suit, with their 3-month outlooks showing Colorado in store for cooler and much wetter than average conditions for the July-September period.
Flood Concerns
This particular monsoon season could be even more intense, thanks in part to the record wet spring. All of that rain (and mountain snow) has greatly increased the soil moisture content of our region. This moisture, through plant transpiration and evaporation, can add further localized fuel to the fire for monsoon thunderstorms. This acts as a positive feedback loop, with past rainfall enhancing rainfall later on. Combining this with the projected wet weather pattern supplied by El Niño and quasi-saturated soils, the flood potential will be elevated into September, particularly in burn scar areas like Fourmile Canyon.
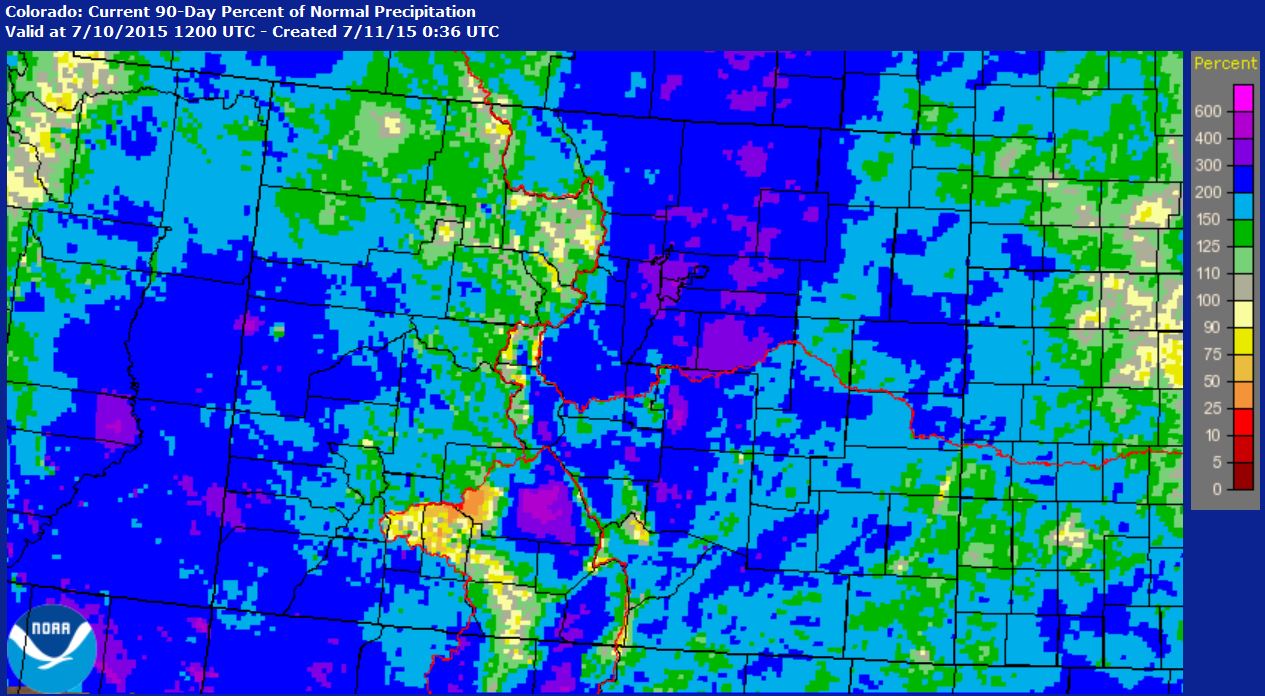
Colorado precipitation over the last 90 days, given as a percent of normal. Nearly the entire state has received above normal precipitation, with the entire north central portion of the state in the 200-400% range.
In summary:
- A moderate El Niño is here to stay through 2015, and will likely strengthen into one of the strongest El Niños in the last 65 years
- Average temperatures will likely be cooler than normal through September, particularly average daytime high temperatures
- Average overnight low temperatures should be near normal, or slightly warmer
- Expect above average precipitation, especially in July and August
We have reviewed the statistics of past El Niño monsoon seasons, and nothing more. Remember, as with most of meteorology, nothing is ever set in stone. Don’t expect anything as historic as the September 2013 flood, but also don’t be surprised if your street briefly turns into a make-shift river at some point!