Two weekends in a row, forecast models get to pat themselves on the back for accurately predicting major snowstorms more than seven days in advance. While this is a great showcase for the advancement of modern numerical weather prediction, it shouldn’t be considered a common occurrence. Model uncertainty, especially that far in advance, is still very large. After all, weather is the poster child for chaos theory!
As this week’s storm slid across the North Pacific Ocean on it’s way to Colorado, we were hesitant to inject any definitive snowfall amounts into our forecasts. Remarkably, looking back, if we had to issue a forecast a week ahead of time, it wouldn’t have looked all that different from our snowfall map the day before. We explain why this storm was a relatively easy forecast, and issue a few words of caution as we head through the second half of our winter season.
The short version
The short answer to the question in this post’s title: IT WASN’T EASY AT ALL. It never is. With the complex terrain surrounding the Denver Metro area, even a tiny shift in track can have storm-busting implications. Forecasting in the Front Range is extremely difficult, especially when it comes to winter weather. Our snowstorms make most East Coast blizzards look like child’s play. Sure, each and every location has its nuances, but the meteorological character of the Front Range is more colossal than the very Rocky Mountains which define our state. Weather forecasting here is definitely not for the faint of heart, nor the inexperienced.
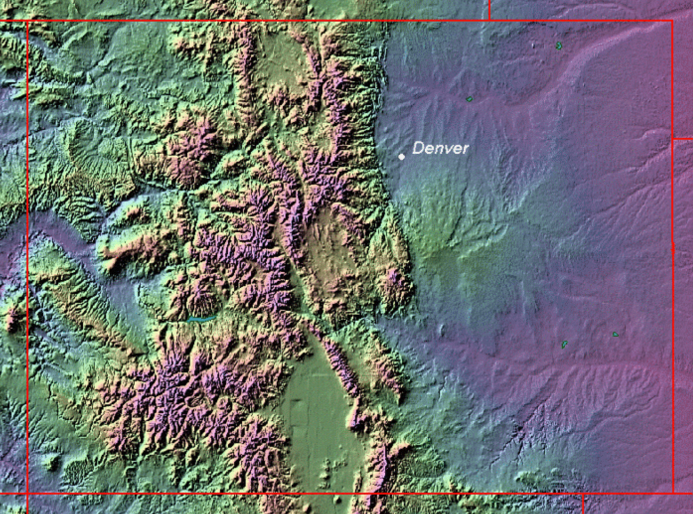
Colorado terrain
Despite our spot-on forecast for this week’s snowstorm, behind the scenes, a few unexpected twists could have busted the storm, either low or high. During the day Monday, easterly winds (our best direction for upslope snow) took much longer to develop than models initially indicated. In fact, southeasterly winds dominated much of the day. And because of the Palmer Divide’s east-west orientation, this wind direction downslopes the Denver Metro area, leading to decreased lift and less snow. Without the heavy snow squall that developed later Monday evening, overall snow totals would have been 4-7″ lower in Boulder, and 2-3″ lower in Denver. On the flip side, had the band persisted a little longer, totals could have quickly gotten out of hand. Read more of our discussion of this heavy band of snow, and many more intricate details of the storm, in our recap post.
The takeaway here: Though it seemed like a trivial forecast that played out to expected results, it was anything but! And yes, that was the short version.
The long version
The long answer here is that it was a comparatively easy forecast. The models made it that way.
Meteorologists are constantly scanning the output from various operational weather forecast models looking at the upcoming state of the atmosphere. It is safe to “trust” what you are seeing a few days ahead. Beyond say five to seven days, it’s really a crap shoot. That far out, more than likely, if you see something interesting in one model, it won’t be there in any others. If the feature is there in more than one, it will probably be gone from both of them in their next run, just six hours later. If not entirely absent, it will be shifted by several hundred miles. This is a battle we constantly fight as forecasters.
The East Coast blizzard two weeks ago and our snowstorm this week were both rare exceptions in long-range forecastability. Multiple models picked up on the storms as much as eleven days in advance. For the Front Range storm specifically, the positioning and timing of the storm remained consistent (and ultimately, near perfect) for the entire week leading up to the event. Why was this the case? It’s hard to say. It definitely helped that both storm systems were very large. Bigger atmospheric waves are easier on the models, simply due to the constraints of model resolution. Despite their size, it was also fortunate that neither upper-level low ever fully closed off from the jet stream. Maintaining this connection with the steering flow provided by the jet increases model skill in storm track and timing. Then again, many systems have these very same qualities and don’t exhibit extreme predictability. It’s unlikely that these storms occurred on consecutive weekends in pure coincidence. It is hard to pin down any one reason why this happened. It was likely a combination of several synchronized factors. No doubt several case studies will come to light in the next year, aiming to answer this very question.
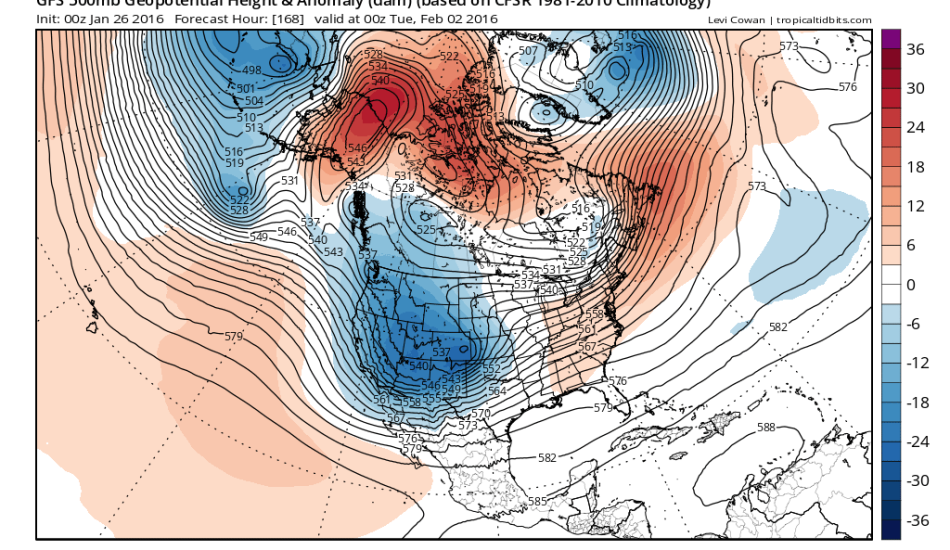
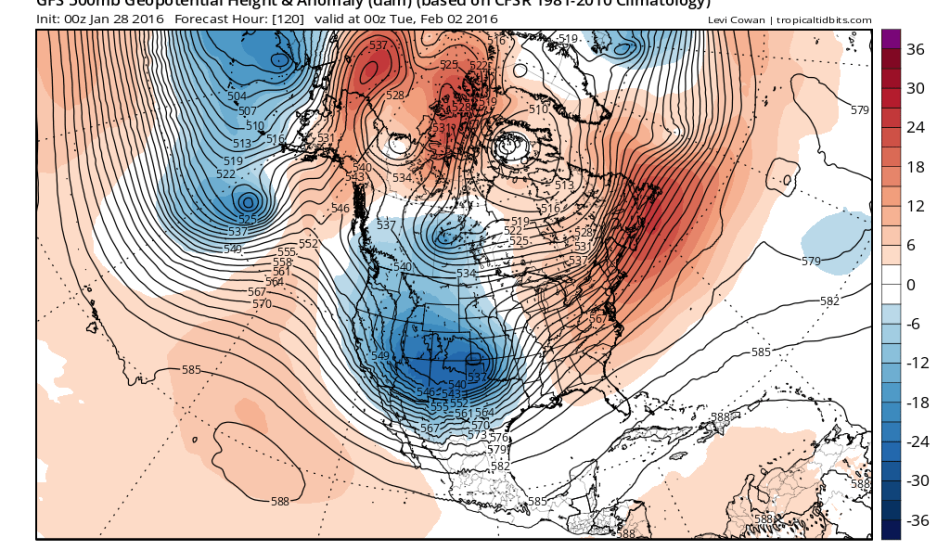
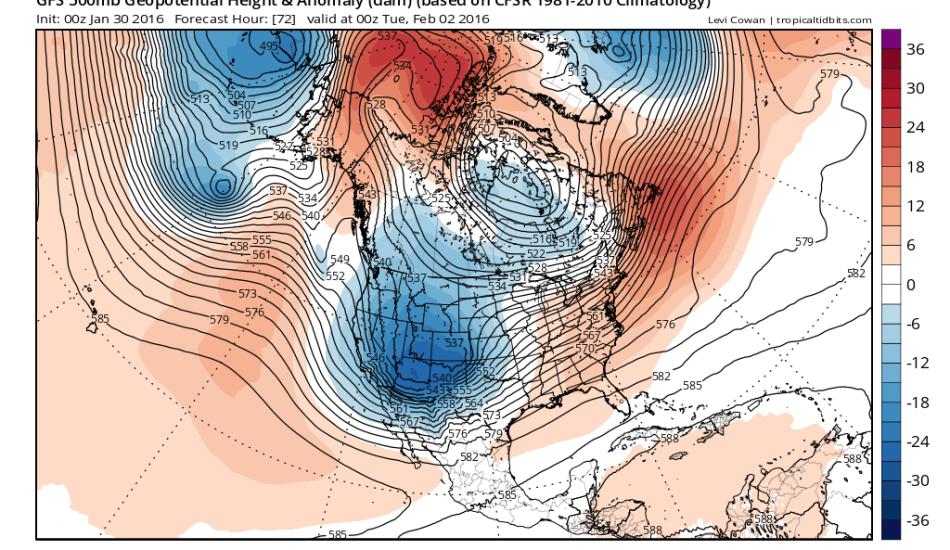
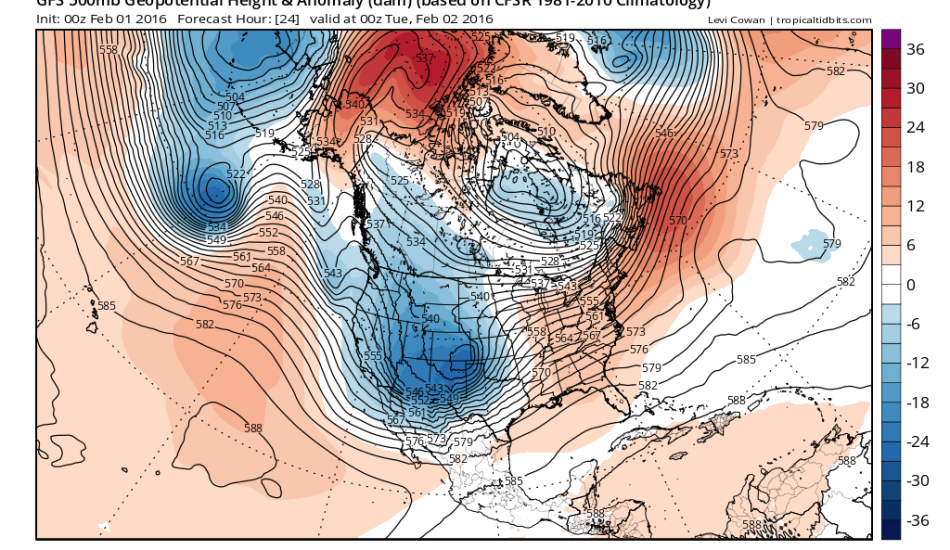
Shown below are various 500 mb forecasts our storm, valid Monday evening at 5pm (during the height of the storm in our area), from model runs initialized in the week leading up to the storm’s arrival. Pay particularly close attention to the initialization dates in the top left corner, as well as the shape and location of the trough across the western United States.
First the GFS model:
And the Euro model:
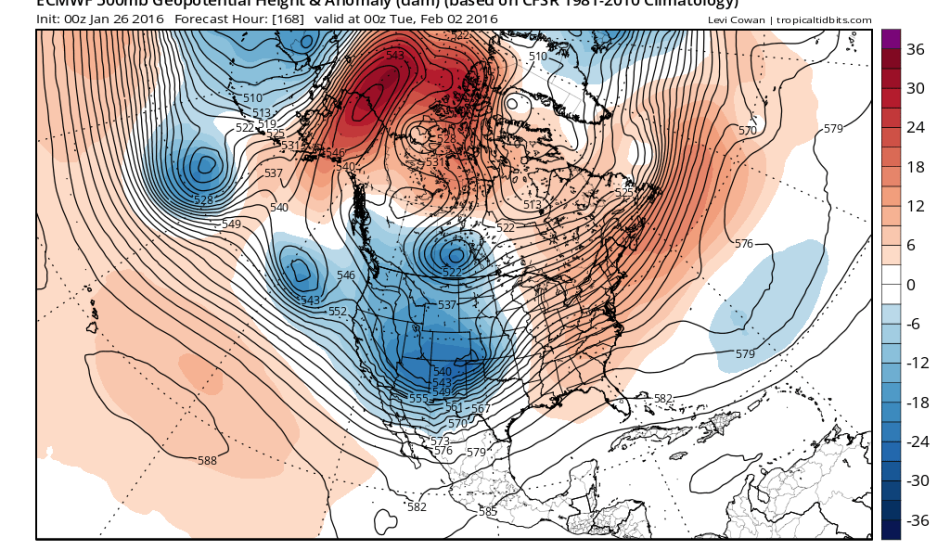
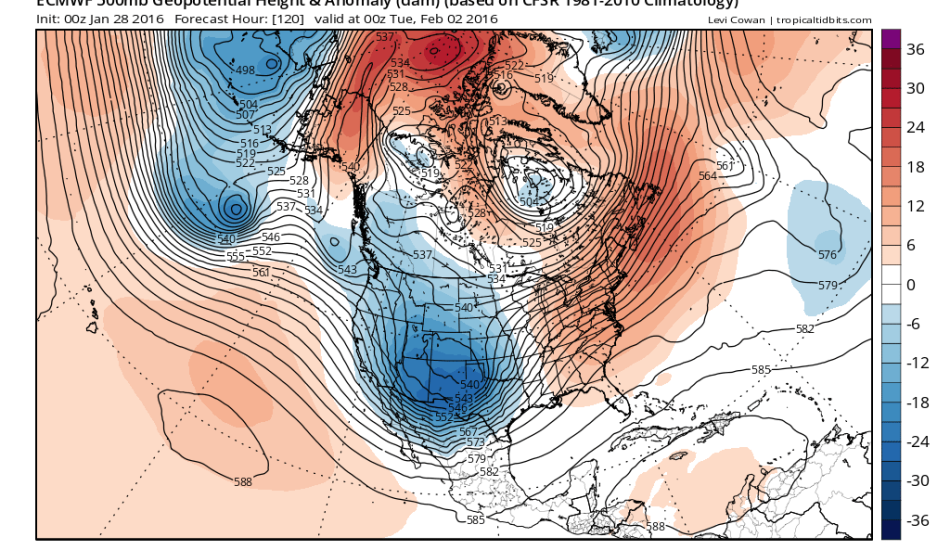
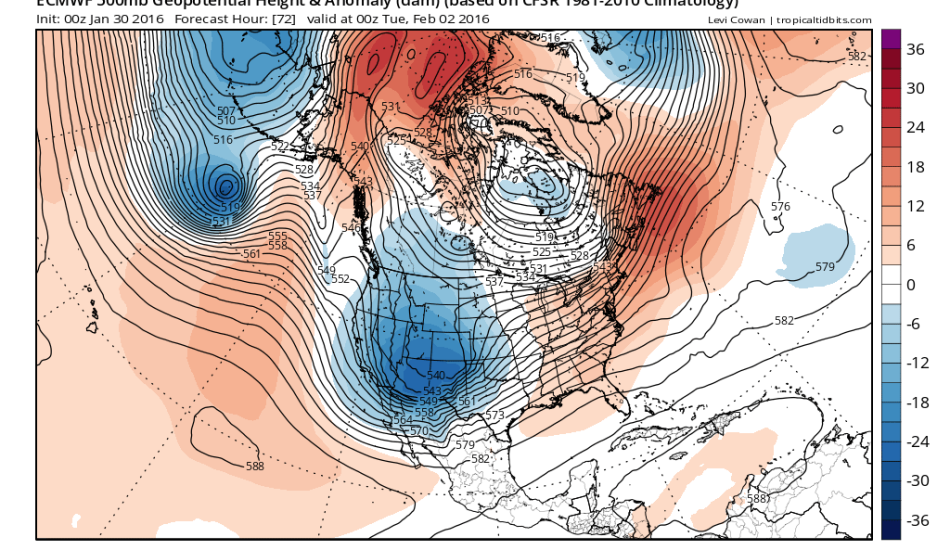

You should notice that from January 26 to February 1st, both models predicted more or less the exact same thing, over and over. They is a little wobble at times, but in general, their initial forecast on the 26th remained consistent. Consistency between models and across several days gave us enough confidence to post an update on Wednesday, January 27th. We didn’t give any amounts at that point, as it was still five days out. Instead, we only warned that a winter storm was probable for Eastern Colorado, and outlined the areas we thought were most likely receive in excess of 6 inches of snow. There is absolutely no justification for providing precise amounts that far in advance.
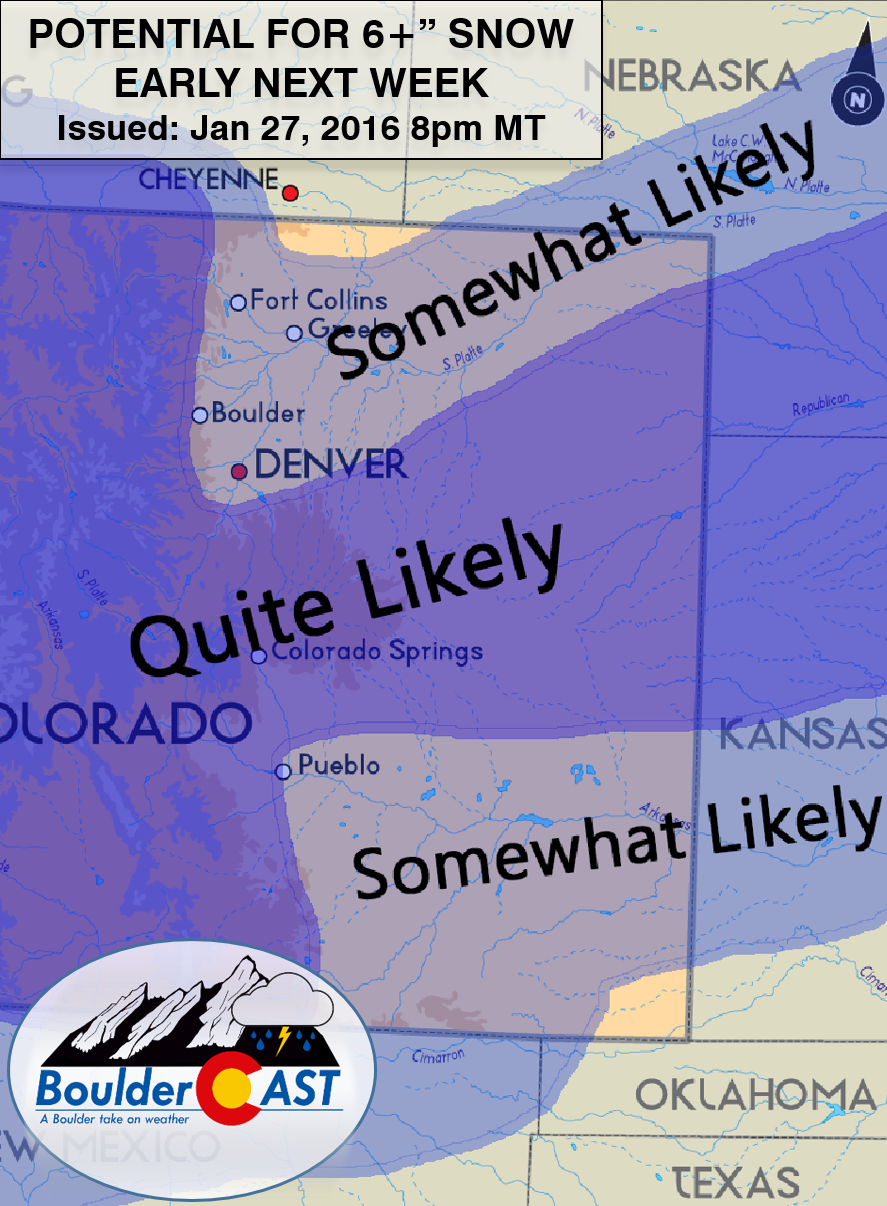
Our outlook for 6+” of snow in eastern Colorado issued six days before the storm arrived
Regardless, as we went into Saturday, we had to be cautious of the storm changing path. It had already defied odds by remaining so predictable thus far. How long could that go on? However, models continued to stick to their guns. It seemed the storm would actually come to fruition…
As forecasters, we have another trick up our sleeves to help breed confidence in a particular forecast: ensembles. Ensembles are created by running weather models many times, sometimes with varying starting conditions or model physics (math). The idea is that the mean or median of all the ensemble runs has more meaning than any single run alone, and that the spread can be used to gauge uncertainty.
If all the model’s ensemble runs spit out similar things, that increases confidence. However, if there is a huge spread in results, confidence goes down. Therefore, if tiny changes to the input data (for example, increasing the water temperatures off the Oregon coast by two degrees) has large implications on the forecast, we need to be cautious.
One of the most frequently used parameters gathered from ensembles is precipitation amount. Here are the GEFS and SREF ensemble cumulative precipitation forecasts from Saturday night (January 30th) for Boulder for the snowstorm. Precipitation amount is on the vertical axis, while time advances towards the right.
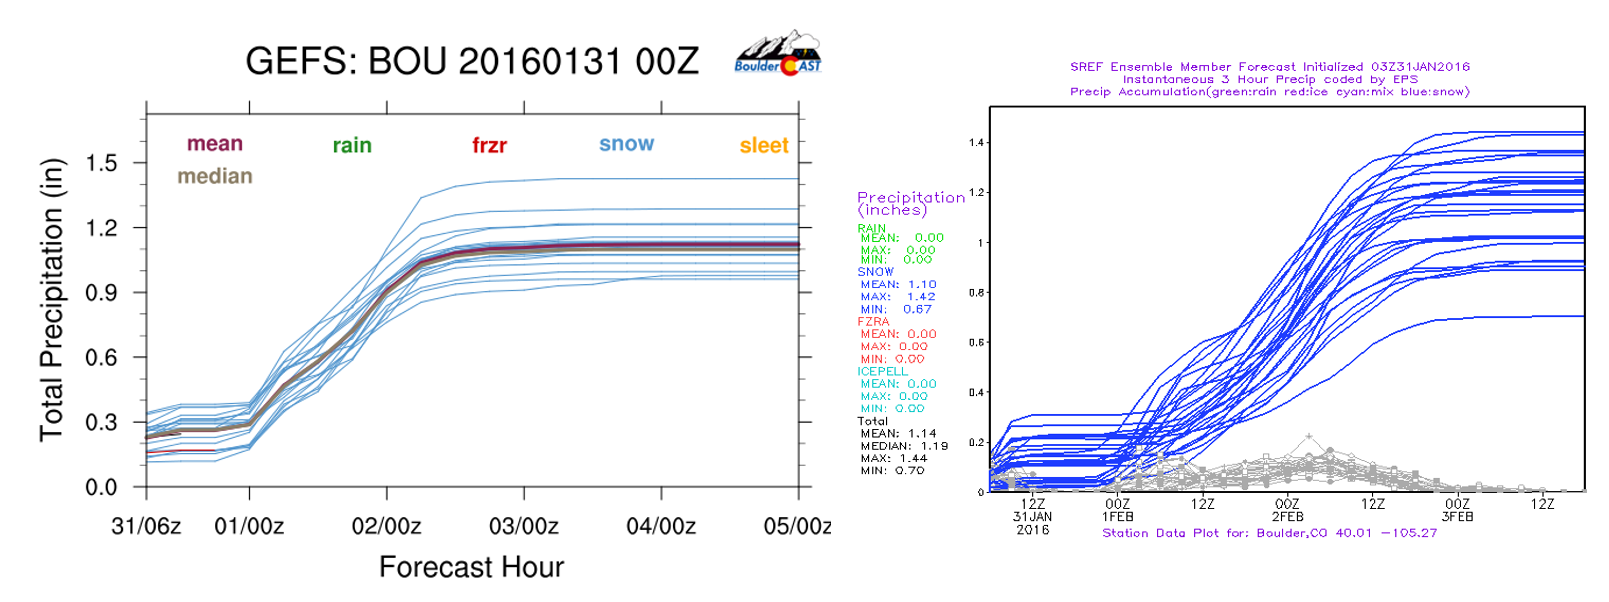
Notice the relatively small spread in both, mostly ranging from 0.8 to 1.4″ of liquid. This suggests snowfall totals of 12-20″ assuming a 15:1 snow ratio. This may seem like a large range, but that is actually about the best you can get from model output for this type of event.
For comparison , here is the GEFS ensemble output from a much earlier run on Thursday morning (Jan 28) for Denver:

GEFS ensemble forecast for precipitation from Thursday, January 28 for Denver. A very large spread indicates a fair amount of uncertainty (as there usually is that far out)
Noticeably more spread, and therefore uncertainty, which lowered our overall confidence. Based on this plot, we can say that Denver will pick up between 4 and 18 inches of snow. Not as cut-and-dry as you may think. You learn the tricks over time… Is that spread significant? Do the models tend to get these types of features right? Does that cold air look reasonable? Will that blocking pattern actually be there to slow down our snowstorm?
Based on the information at hand and taking into account everything we mentioned here, we issued an update on Saturday, January 30th, with some preliminary amounts, and then our final snow forecast the following day.
Forecasting this storm was by no means easy. It was a long haul . From the moment it piqued our interest in the models 180 hours out, until the flakes stopped falling, spanned ten days. Most of that time was spent just waiting for the storm turn away from the Front Range or disappear completely. It never did, but more than likely, it will next time.
Weather pro tip of the week
With that, we leave you with a few wise words of warning. Following the successful forecast of two major winter storms more than a week in advance, we have noticed a major uptick in the amount of preemptive, click-bait “Snowmageddon” weather forecasts appearing online. While forecasting skill has improved immensely over the last thirty years (seriously, forecasting the weather just three days ahead of time used to be luck-based), we’re just not to that point yet.

Please don’t click on, pay attention to, or spread information regarding an impending Snowpocalyse more than a few days away. I personally have already had to bring two different people (from the East Coast) back to reality in the last two weeks. They heard through social media or from those around them that a big snow storm was coming in ten days (neither amounted to anything at all). The deluge of shoddy winter forecasts is going to happen. Don’t be caught off guard!