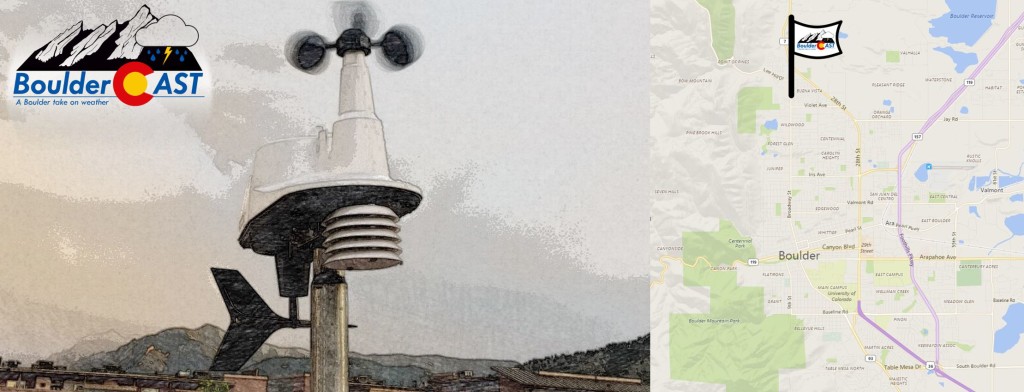
We’ve been tracking basic atmospheric surface parameters at BoulderCAST Station since 2015. Recently we have added a laser particle counter that monitors air quality. Read on for details on how air quality is measured, why it matters, and where you can find the data from our sensor.
The instrument
Not long ago we installed an air quality sensor co-located with our main surface weather station in North Boulder. The instrument consists of two laser particle counters and is manufactured by PurpleAir. The lasers count the number of particles suspended in the ambient air at sizes ranging from 0.1 to 10 microns in diameter. It does this by bouncing a beam of light off the suspended particles which are moving at a known speed. The system measures the returned signal’s duration. The longer the duration, the large the particle. Using the information about particle sizes and counts, we can derive the PM2.5 and PM10 concentrations and Air Quality Indices (AQIs).
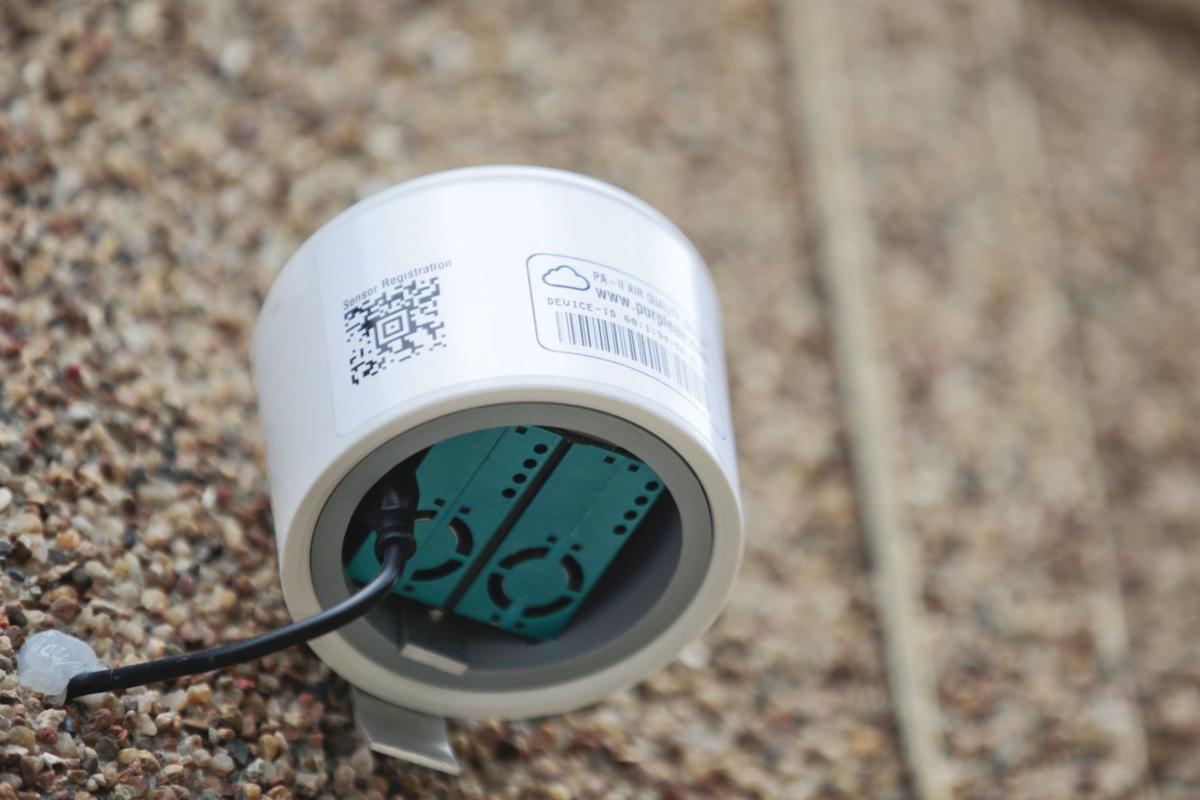
PurpleAir sensor
This sensor is the same one that has been deployed across the nation as a low-cost and highly-accurate alternative to monitor localized air quality. Grand Junction and Salt Lake City are among the many cities which have installed large networks of these sensors in an effort to better understand how unhealthy their air really is. The standardized reference sensors, sanctioned by the EPA, are complicated and very expensive. Recent studies have confirmed simple particle counters can produce nearly identical results to their much pricier EPA counterparts in many circumstances. Laser particle counters do need to make some assumptions about the particles they are counting to round-out their algorithm, so there is elevated uncertainty (error) in their reported values.
Another major limitation of particle counters, including our PurpleAir sensor, is that they ONLY measure particulate matter (PM). Gaseous constituents, such as ozone, NO2 and CO, are also important to air quality. These gases however cannot be monitored in the same manner and require more expensive instrumentation. We hope to add another instrument for monitoring some or all of these gases later in 2019.
What exactly is PM?
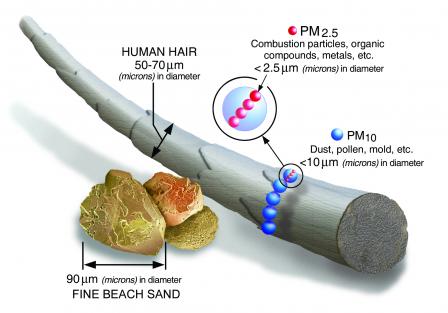
PM in air quality lingo is short for particulate matter, which is a mixture of solid particles and liquid droplets present in the air. Some particles, such as dust, dirt, soot, or smoke, are large or dark enough to be seen with the naked eye. Others are so small they can only be detected using lasers and microscopes.
The PM2.5 category denotes particulate matter which is smaller than 2.5 microns (also known as FINE particulate matter), while PM10 denotes particulate matter smaller than 10 microns (also known as COARSE particulate matter). The diagram below created by the EPA demonstrates just how small PM2.5 and PM10 particles are by comparing their size to a human hair and a grain of sand.
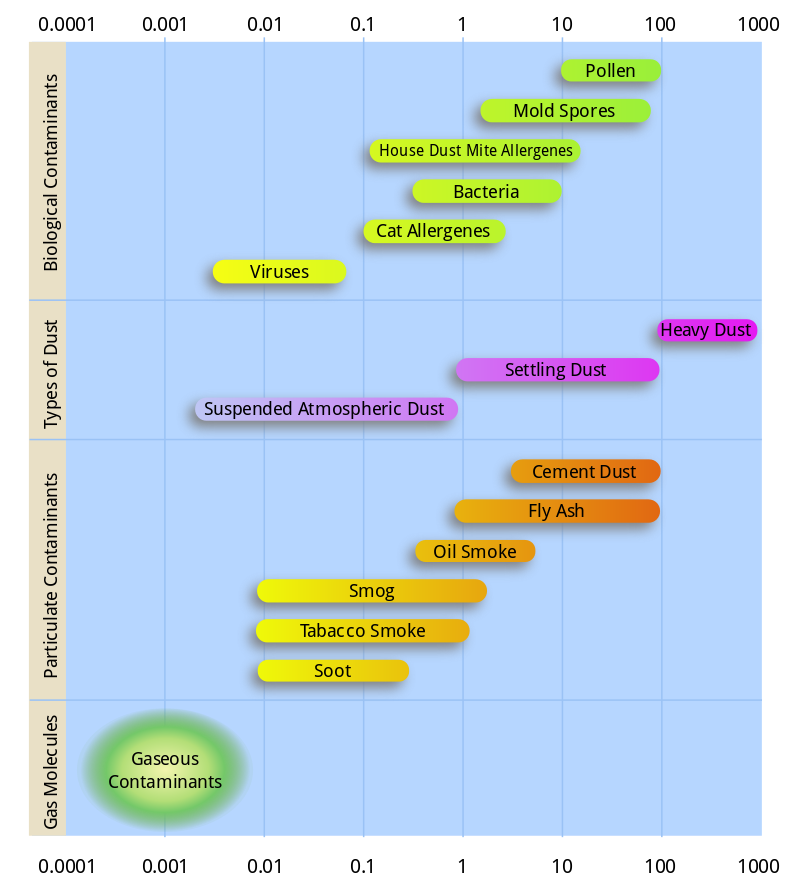
Below is a diagram showing the size ranges of various suspended particles in the air. The horizontal scale is in microns. The largest value on the right, 1000 microns, is equal to 1 millimeter for reference.
Both PM2.5 and PM10 particles are important to air quality. They are small enough to be inhaled directly and can penetrate deep into the nooks and crannies of your lungs. PM 2.5 particles are considered the most dangerous for health as they can easily permeate into your bloodstream. These particles come in many sizes and shapes and can be comprised of hundreds of different chemicals (gross!). Some particulates are emitted directly from a source, such as cement factories, agricultural fields, smokestacks or forest fires. However, most particles form in the atmosphere as a result of complex chemical reactions, usually involving pollutants emitted from power plants, industry and cars.
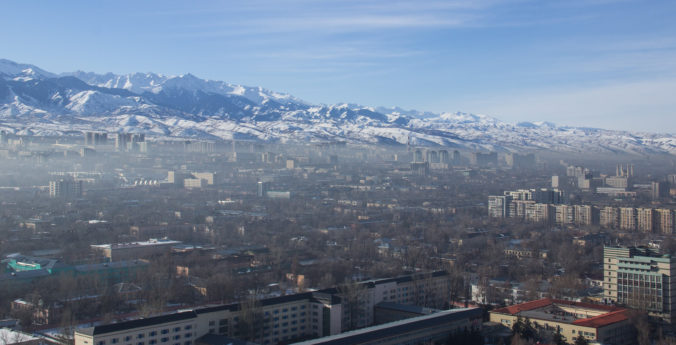
In addition to being the worst for your health, PM2.5 is also the main contributor to reducing visibility. On those days where we can barely see Longs Peak, you can bet PM2.5 is elevated!
How is PM related to AQI?
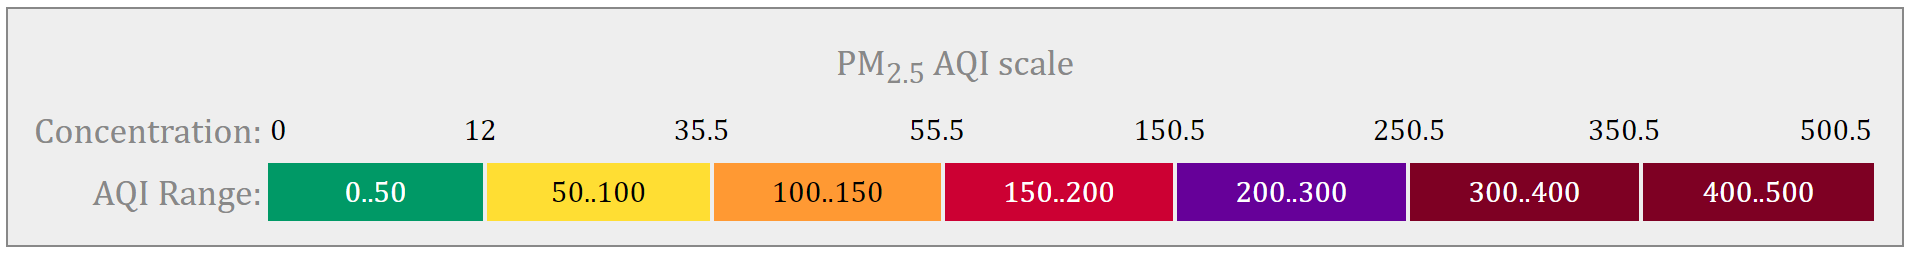
The EPA has defined air quality standards for six different gases and pollutants. These include PM 2.5, PM10, ozone, sulfur dioxide, nitrogen dioxide, and carbon monoxide. Each of them have different EPA-standards, that is, the amount that is considered tolerable vs. unhealthy with various levels. In order to standardize this concept across the board, the EPA created the Air Quality Index scale which maps the concentrations of each constituent to a shared index scale. The table below shows how the PM2.5 concentration fits into the AQI scale.
The overall AQI is equal to whichever of the six indices is highest.
Access our data:
You can access our real-time PM2.5 air quality data in the sidebar or by going to the Weather>Current Conditions>Air Quality tab in the drop-down menu.
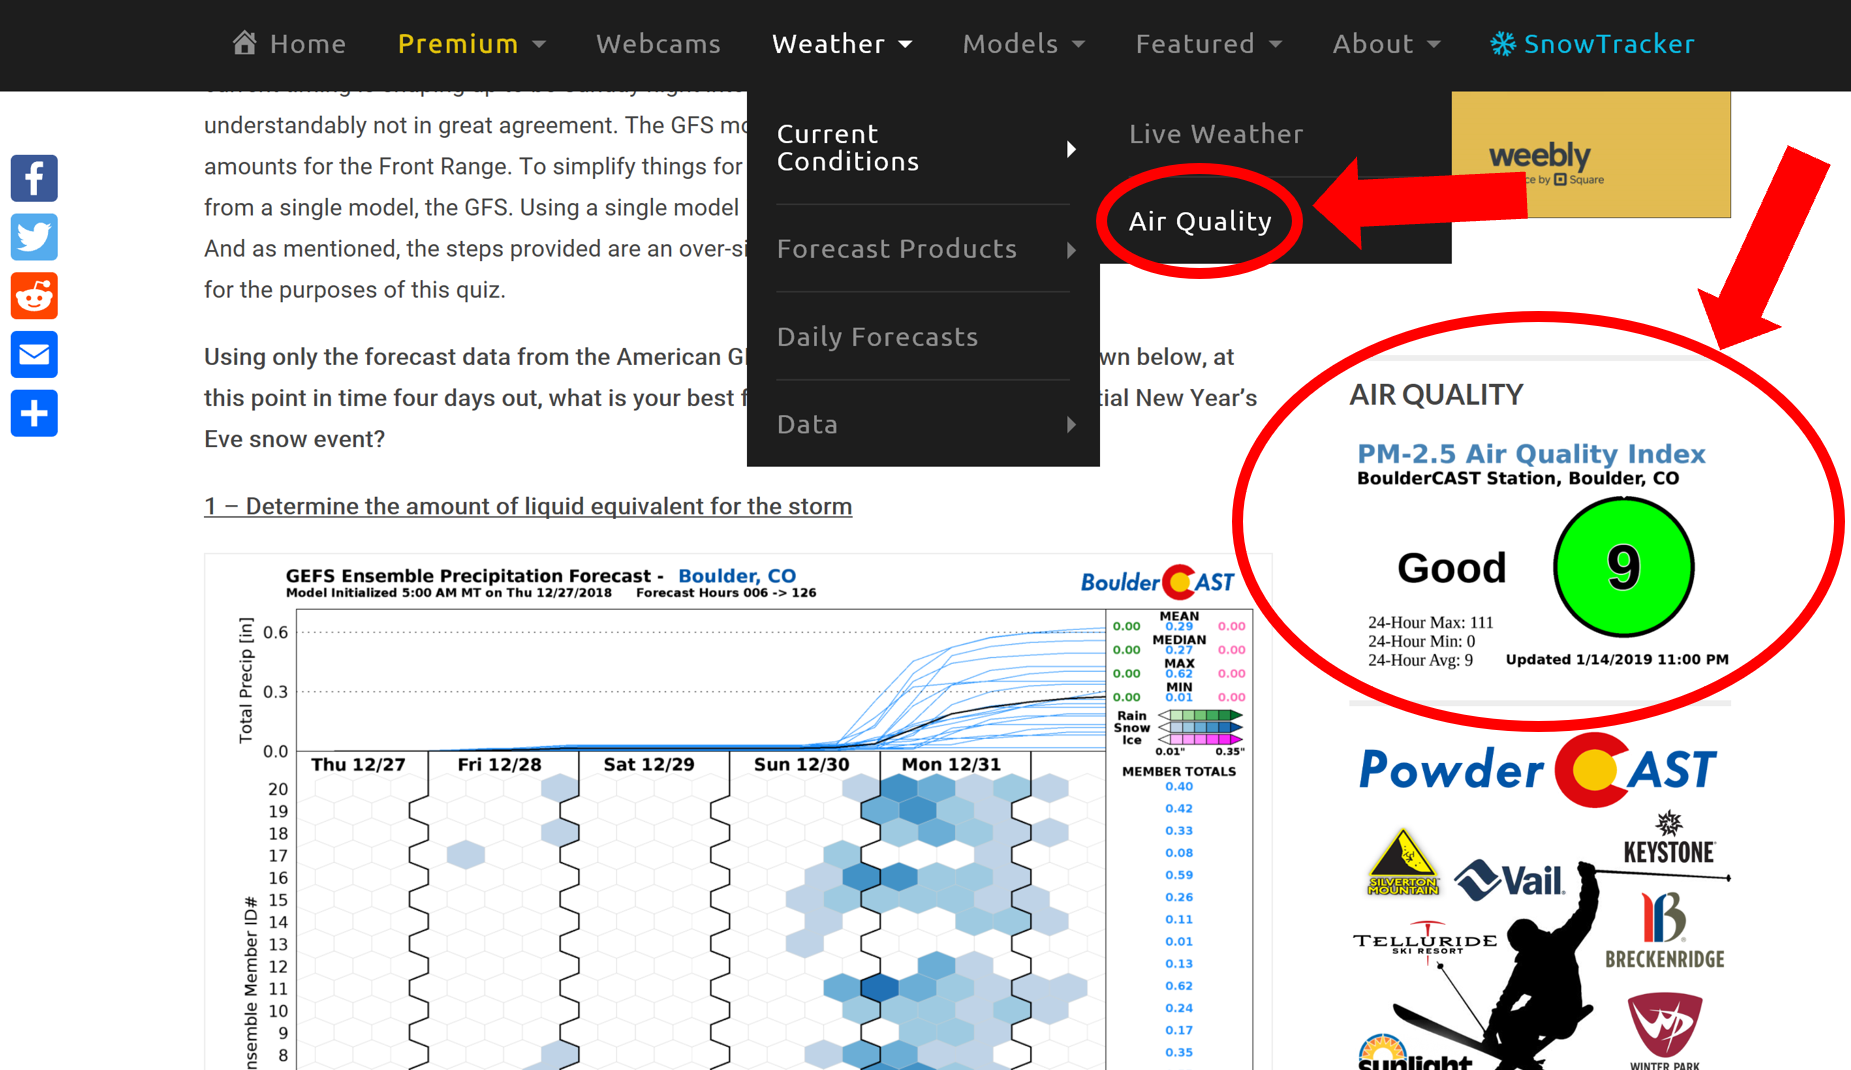
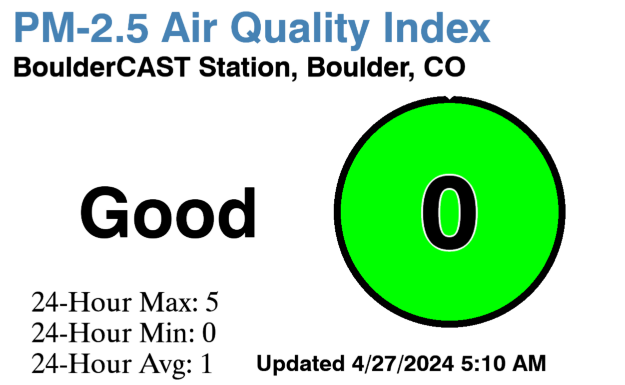
Once there, you will be able to find the current PM2.5 Air Quality Index…
…as well as the history for the current date. For example, here is yesterday’s AQI graph. It is not very difficult to locate the morning and evening rush hours…
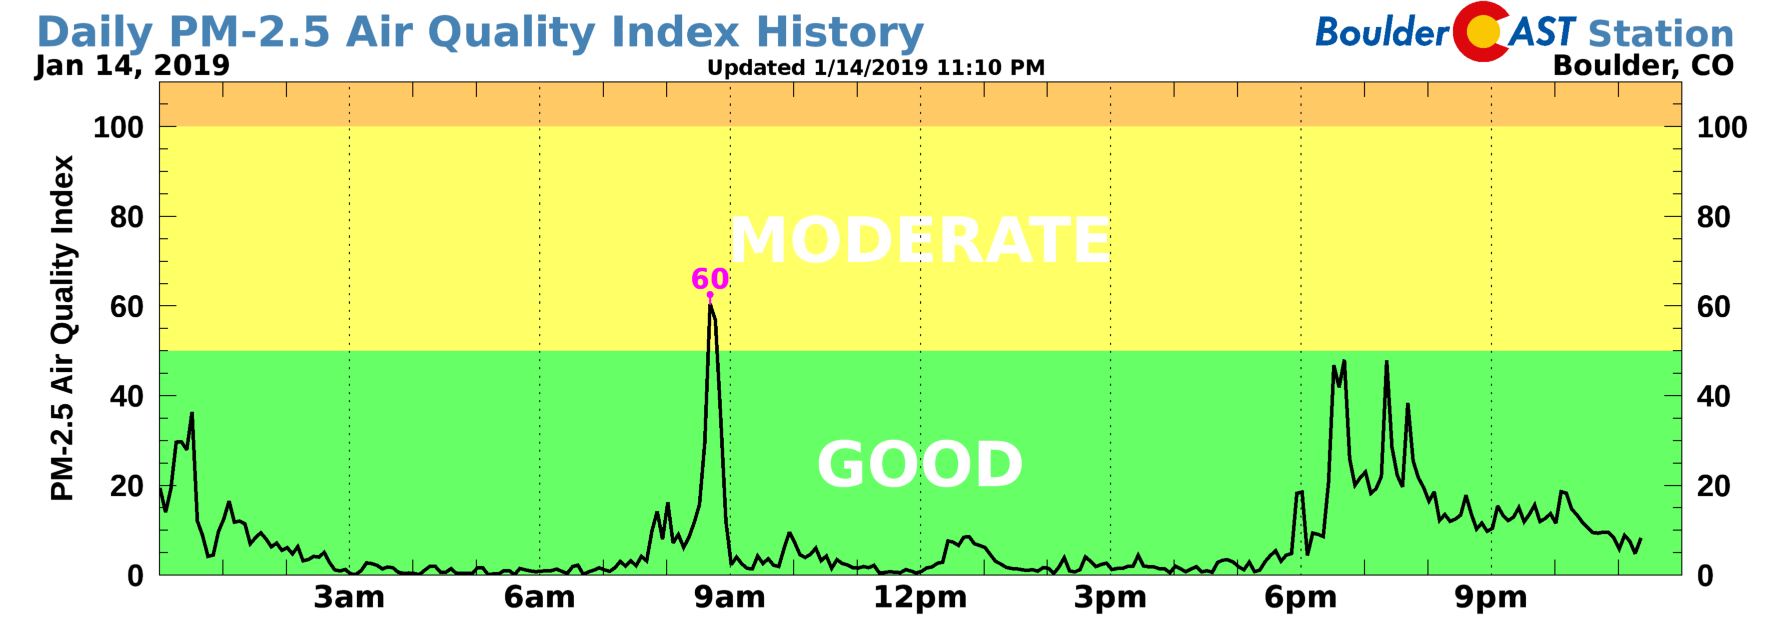
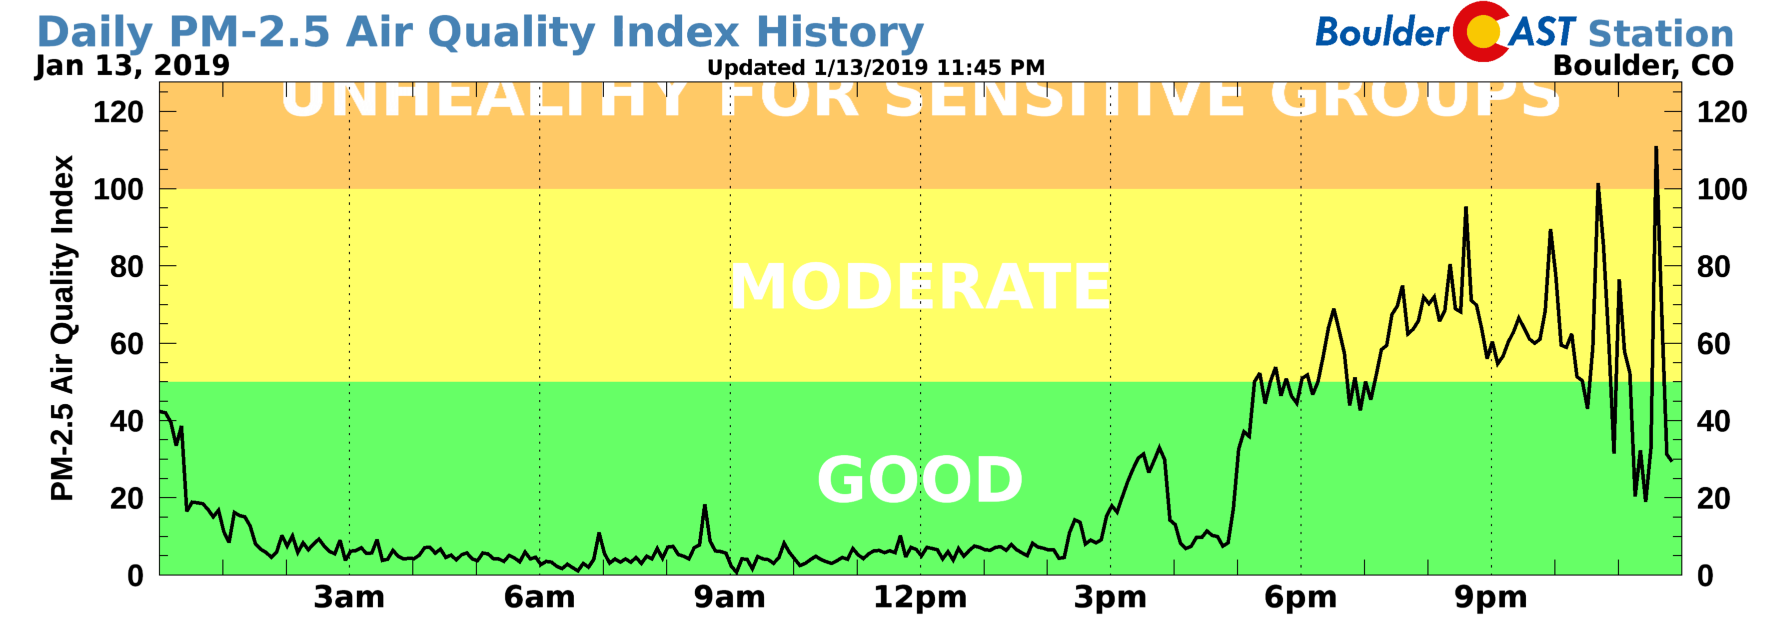
And here’s Sunday’s graph:
We plan to add PM10 AQI soon, as well as toggles to show measured concentrations of particulate matter.
Special thanks to our friend and colleague Dr. Rui Li in Boulder for her expertise in air quality and instrumentation!
Want to install your own air quality sensor?
Are you interested in the air quality outside your own home or even indoors? PurpleAir sensors are very easy to set-up and relatively low-cost. The sensor can be installed anywhere that has AC power and a WiFi connection. It will automatically upload your data to the cloud. They also make a cheaper indoor model with a full-color display, if that’s your jam. PurpleAir sensor pricing ranges from $179 to $259. We highly recommend them!
Share this information about our air:
.


You must be logged in to post a comment.