
We often include at least some discussion in our wintry forecasts about snow-to-liquid ratios. In this post, we explain what they are, why they matter, and examine the historical snow ratio record for Front Range Colorado.
What is snow-to-liquid ratio?
By definition, snow-to-liquid ratio (also know as snow ratio, or SLR for short) is the ratio of the depth of snow that falls to the depth of liquid water contained in that snow (if it were to be melted). Therefore, higher SLRs indicate a drier snow (the kind that everyone just loves to shovel!) and lower SLRs indicate wetter snow (the kind that makes for the best snowballs and snowmen).
A very sloppy, springtime snow may have a ratio of 6:1, whereas a winter dumping of fluffy powder at the top of Arapahoe Basin may have a ratio closer to 30:1.
Why does snow ratio vary?
Accumulating snow is a mixture of ice, air, and if warm enough, liquid water. SLR is really just a gauge on the density of the snowfall….the total amount of water per volume of space. As you may suspect, SLR is therefore controlled by the shape/type of snowflakes contained in the snow. Indeed, some shapes fit more closely together than others as they accumulate on the ground.
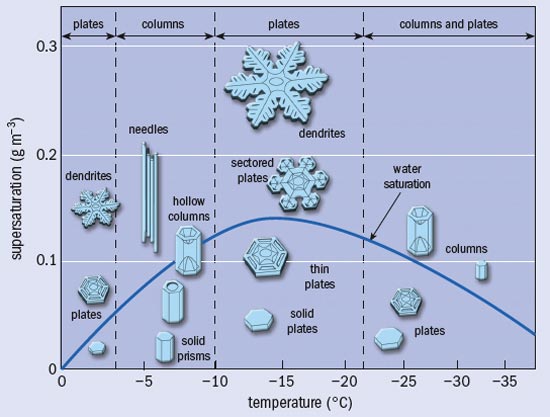
So predicting the snow ratio is as simple as predicting the type of snowflakes! Easy right? Wrong. The type of snowflakes that form and fall to the ground depends strongly on temperature, and to a lesser degree, available moisture, in the atmosphere above. The diagram below is one that is familiar to all meteorologists. It shows the types of snow crystals that form at various temperature and moisture ranges in the atmosphere. This graphic is massively over-simplified, but you get the picture.
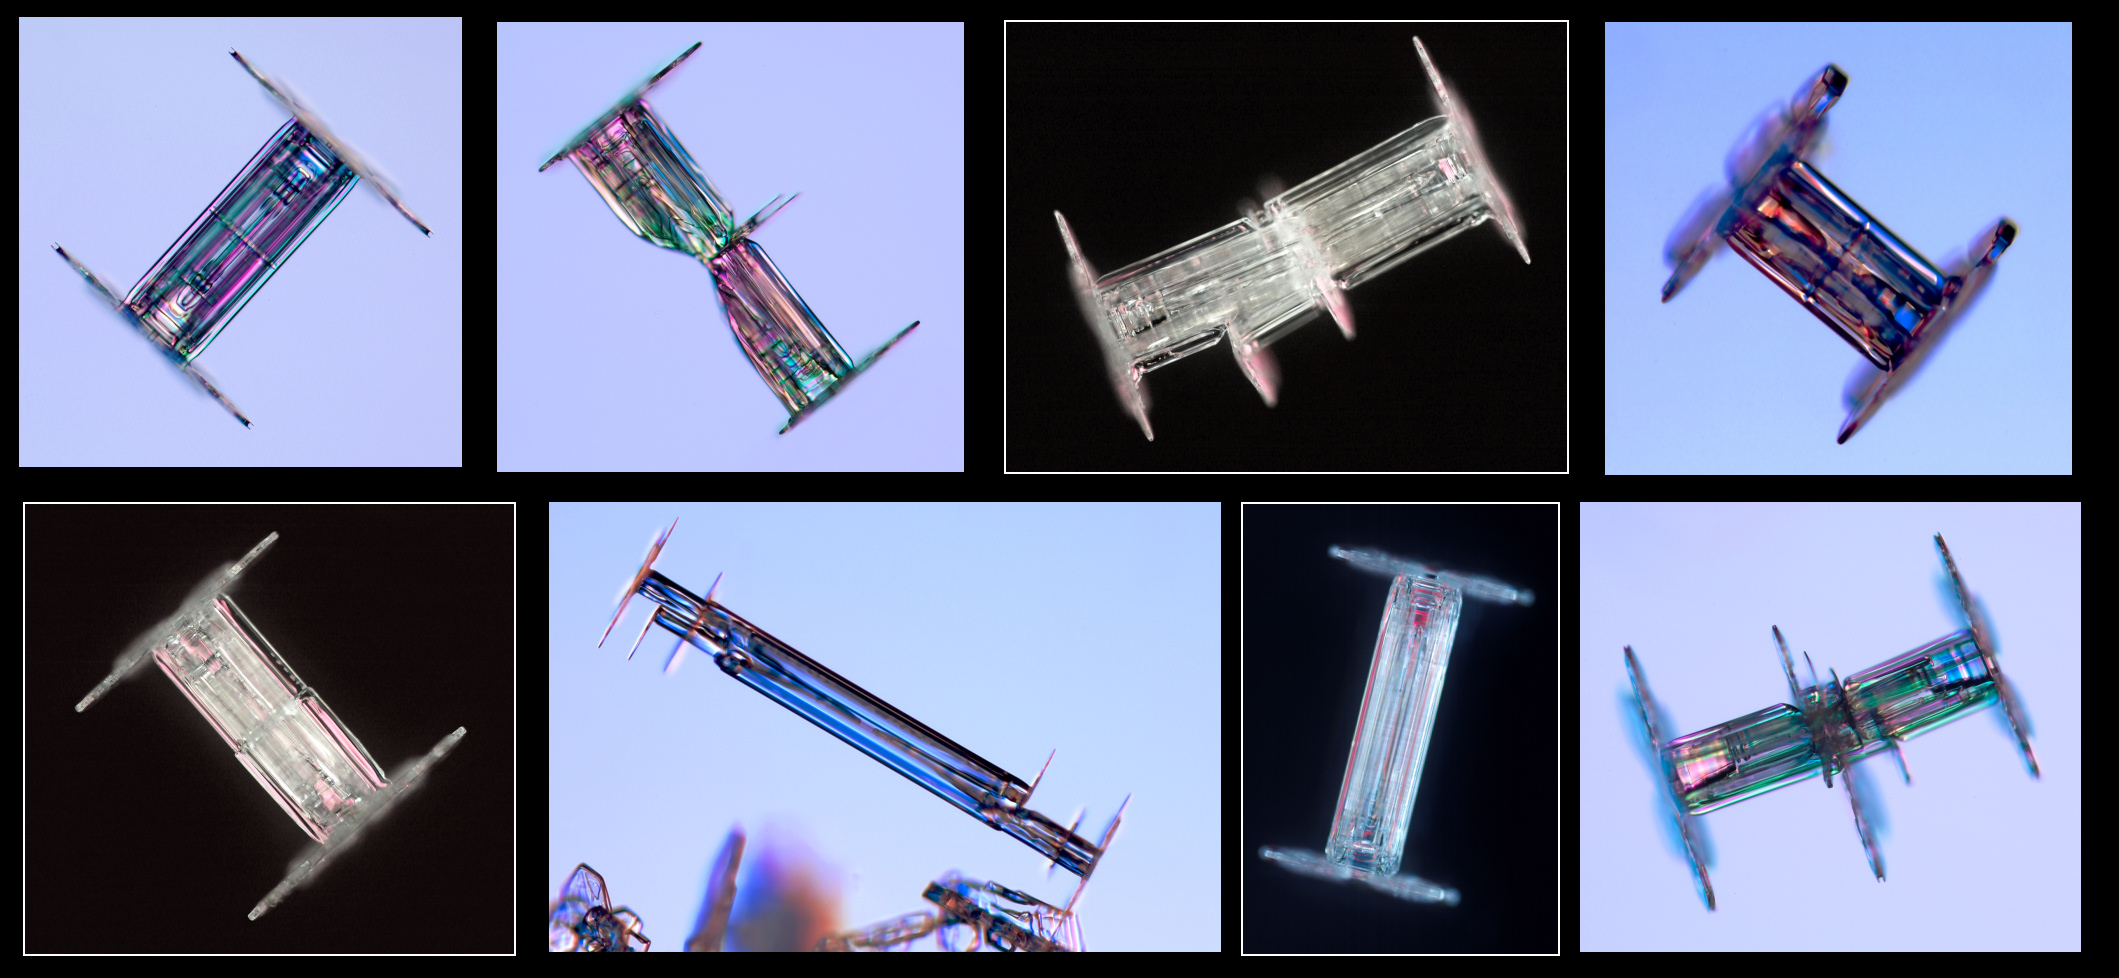
Everything is further complicated by the fact that snowflakes don’t just exist at one specific cloud level with a constant temperature and moisture. In many cases, they grow through a large depth of the atmosphere, with temperatures that could potentially span the entire left-to-right extent of the diagram above. As a result, at any given time, falling snow may consist of five or more snowflake types mixed together. Admittedly, there is usually one or two dominant ones that make up the majority of the flakes, but this isn’t always the case. And sometimes, snowflakes can begin to grow as one type initially, and as they fall, morph into another. My favorite example of this are capped columns (shown below). They begin their life as a ice column, and as they fall closer to the ground, they shift on the diagram above to another regime dominated by plate growth. The net result is a snowflake that looks like two wheels on an axle!
The images below are magnified photos of snowflakes that myself or someone else in my former research group took in Greenland. As you can see, there is quite the range of possibilities to consider.
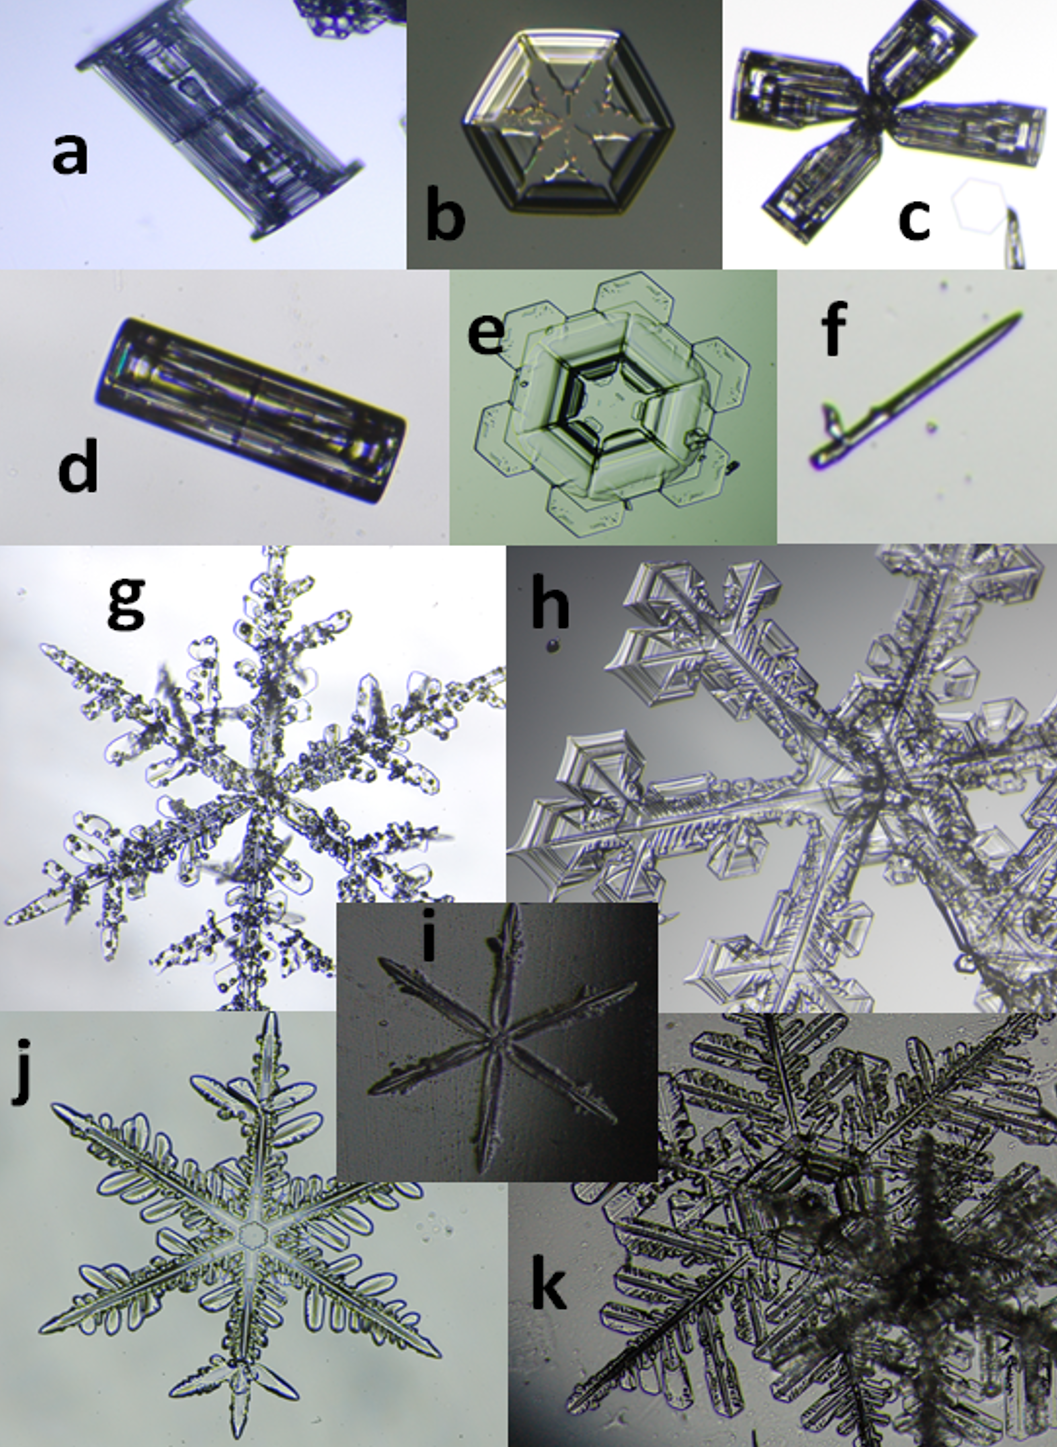
Assorted snow crystals photographed in Greenland. Shown are (a) capped column, (b) hexagonal plate, (c) bullet rosette, (d) hollow column, (e) stellar plate, (f) needle, (g) stellar dendrite, (h) sectored plate, (i) simple star, (j) radiating dendrite, and (k) fernlike stellar dendrites.
Generally the more broader snowflakes, like dendrites, tend to collect on the ground with the lowest density. Thus, snow events with many dendrites tend to have the higher snow ratios. This hints at our next question….
Why does snow ratio matter?
Snow ratios are very important to meteorologists that are interested in accurately predicting snow amounts. This is because operational weather models are not well equipped to predict the amount of snow that may fall, mainly due to a lack of math to characterize snowflake micro-physics. Instead, models take a “simpler” approach and provide precipitation amounts in units of liquid equivalent (rain), along with a precipitation type. From this information, a snow ratio is then required to convert what the models predict into an actual snowfall forecast.
To put this into perspective, think about this… If the models were somehow able to predict with 100% certainty the next snow storm will produce exactly 1″ of liquid for Boulder, and given the sizable variation in the snow ratio, the storm could potentially produce anywhere in the range of 6 to 25″ of snow!
How do we predict snow ratios?
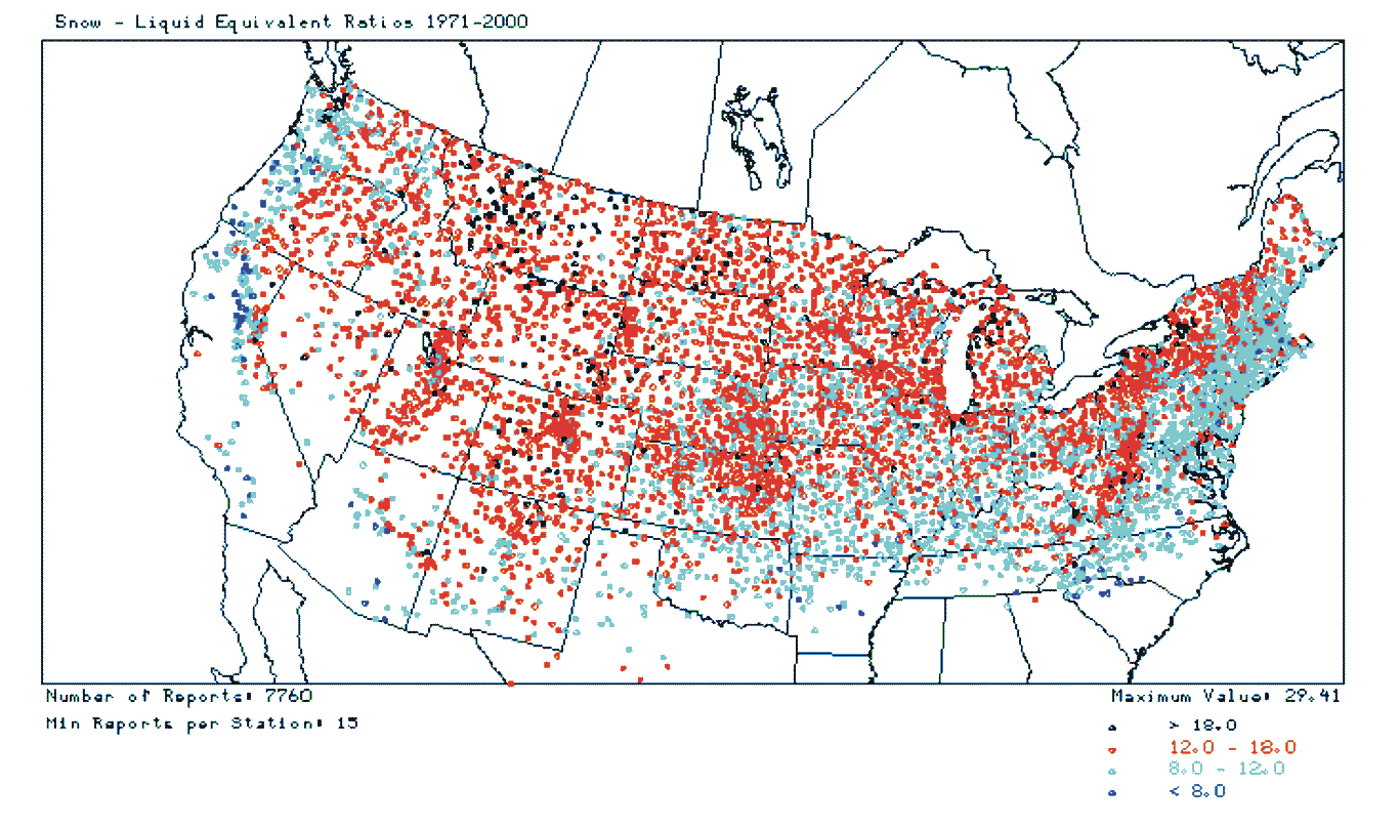
A well-known, but bad rule-of-thumb is that 10 inches of snow will contain 1 inch of water, a 10:1 ratio. The map below of snow ratio climatology for the United States shows this rule-of-thumb is misguided. A 10:1 ratio (light blue color below) is only common in the southern (warmer) areas and along the coastlines where relatively warm ocean waters feed heat and plentiful moisture into snowstorms. However, for much of the country, including the Front Range, snow ratios are actually higher, generally between 12:1 and 18:1.
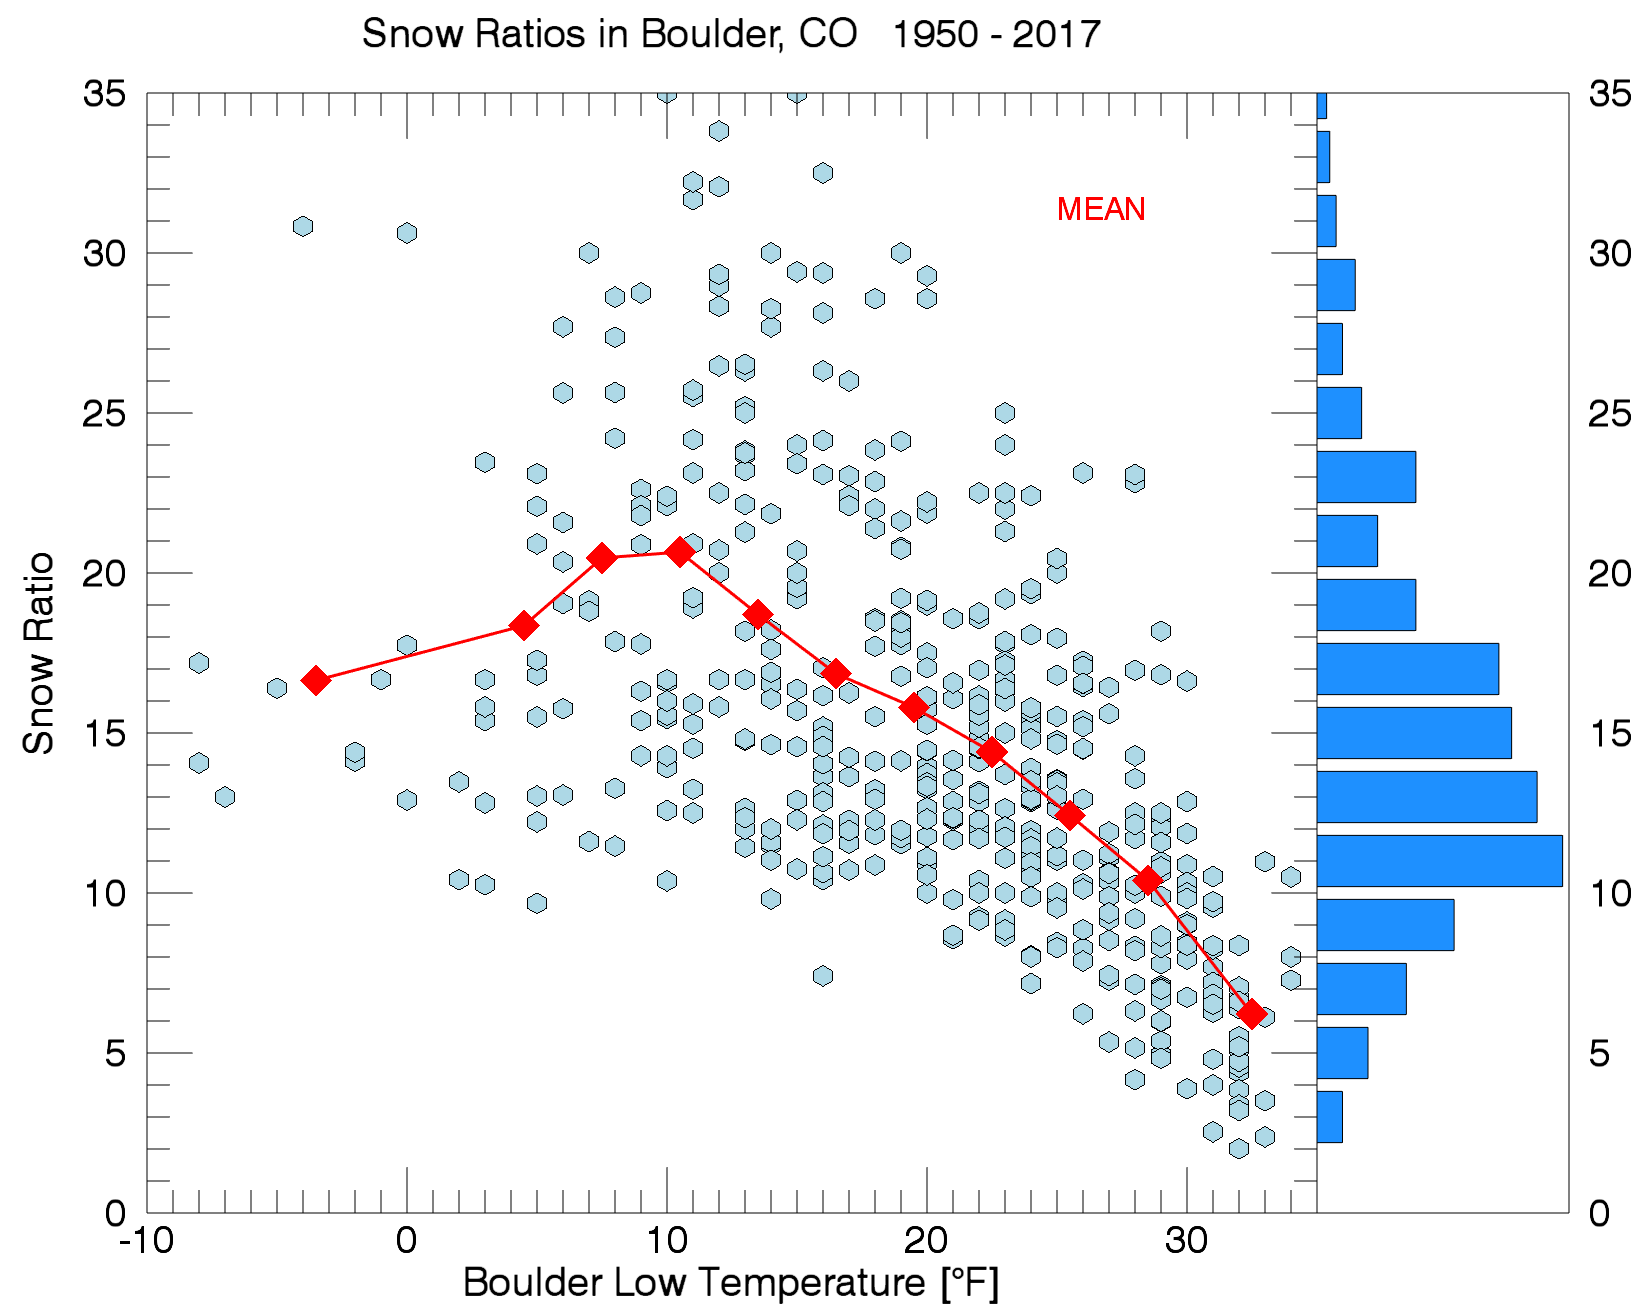
By simply looking at the relationship between storm low temperatures and historical snow ratios in Boulder (shown below), there is a clear trend: snow ratio increases as temperatures get colder. However, once temperatures get too cold, snow ratios start to decrease again. This is because dendrites then become less likely, with snow crystals trending towards mainly columns and bullets, which collect on the ground in a denser fashion. Based on the graphic below, snow at temperatures this cold rarely occurs in Boulder, but trust us when we say it’s much more frequent in the Foothills.
The median snow ratio for all storms since 1950 in Boulder is 14:1….
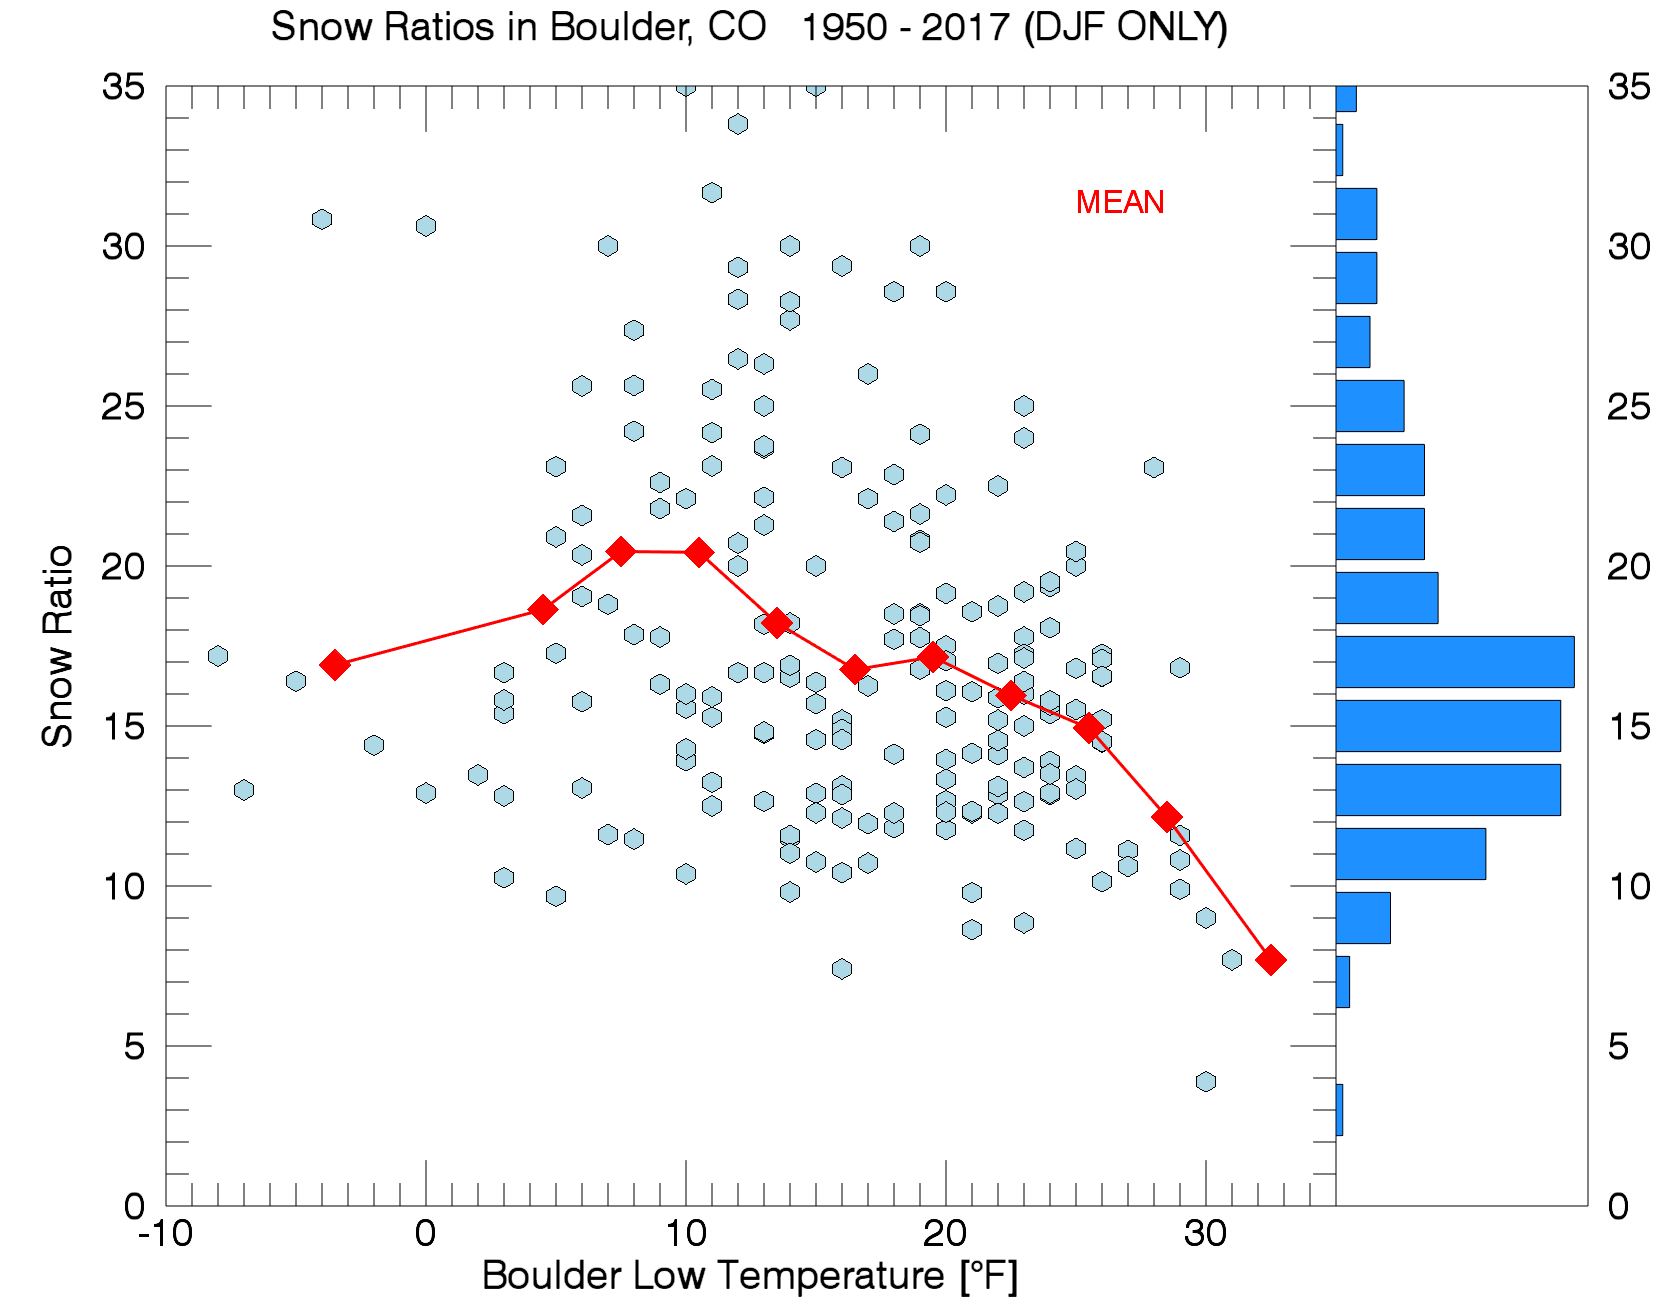
Due to the way Boulder weather data has been collected over the years, there is no easy way to filter out snowstorms that also started as or mixed with rainfall. Therefore, the graphic above likely is biased low due to some rainfall being included in the snow ratio calculations. To work around this, let’s look at only the months of December, January, and February. These are our coldest months which have much lower chances that rain would have occurred. Not much change in pattern overall, except the histogram on the right shifts upward.
When considering just the winter months, the median snow ratio in Boulder is 16:1….
So we have learned that the colder it gets, the more dendrites that form. This leads to higher snow ratios. This is the basic formula that we sometimes employ using low-level model temperatures to “assign” a ballpark snow ratio to the storm. This simple approach is often just as good as more complicated ones.
At BoulderCAST, we have developed a more complex snow ratio prediction algorithm derived from the “Cobb Method”, as it is known. Our method helps to account for variations in snow ratio over time and includes adjustments for specific atmospheric flow patterns near topography. In every single storm, the temperature and moisture structure of the atmosphere above is always changing….and thus, so is that pesky snow ratio. Using model temperature, moisture, and vertical velocity forecasts through the depth of the atmosphere, snow growth layers above are weighted and combined into a single snow ratio that varies in time. With this, we can improve the forecast for snowfall over just guesstimating a 10:1 or 15:1 ratio. We use this adaptive snow ratio throughout all of our snowfall forecast products, including PowderCAST, SummitCAST, and our Snowfall Probability Charts.
The GFS forecast maps below show results from our algorithms for a potential snowstorm across the Front Range next Monday (March 26th). The left map shows precipitation type, with the snow ratio for Colorado on the right.
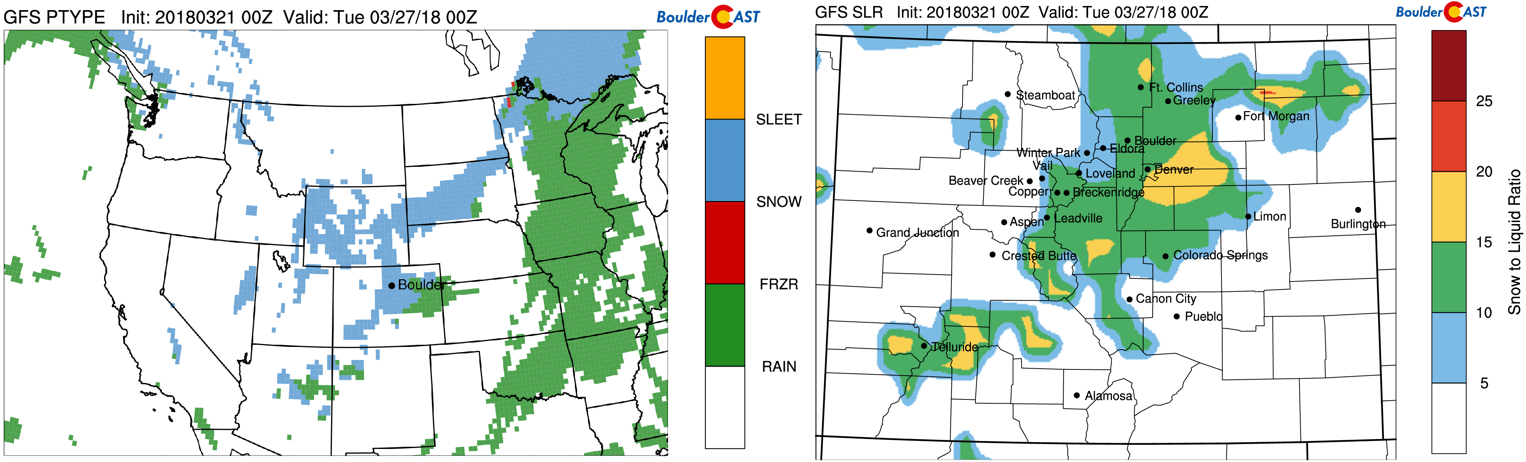
GFS model-derived snow ratio forecast (right) and precipitation type (left) for March 26 2018, from BoulderCAST Models.
The table below shows the ten biggest snow events of the 2017-18 winter (so far). Notice how the snow ratio has varied from storm to storm this winter.
Boulder Snow Ratios for 2017-18 Winter
| Storm Date | Snow | Liquid | Snow Ratio | Was There Rain? |
|---|---|---|---|---|
| 10/9/17 | 6.0 | 0.92 | 7:1 | Yes |
| 10/26/17 | 1.6 | 0.14 | 11:1 | Yes |
| 11/7/17 | 4.1 | 0.46 | 9:1 | No |
| 12/14/17 | 2.1 | 0.18 | 12:1 | No |
| 12/21/17 | 3.5 | 0.22 | 16:1 | No |
| 12/24/17 | 3.6 | 0.25 | 14:1 | No |
| 1/21/18 | 7.1 | 0.67 | 11:1 | No |
| 2/10/18 | 5.7 | 0.34 | 17:1 | No |
| 2/19/18 | 8.8 | 0.45 | 20:1 | No |
| 2/23/18 | 2.5 | 0.14 | 18:1 | No |
.
Of course, snow ratio is not the only factor to consider in a forecast, or even the most crucial one. Nonetheless, they are a part of every snow forecast we make! Keep everything you learned here in mind for when we inevitably discuss snow ratios with our next winter storm…

Don’t forget, snowflake. Know your place!
.
Help us spread Colorado weather… Share this post!
.


You must be logged in to post a comment.