
In this second iteration of the Life Below Zero series, I cover the physical training and medical clearance needed to travel to Greenland, my second and much colder trip up north in the middle of polar winter, and a bit of the science behind my research.
Hopefully you have already read and enjoyed the first and introductory post regarding my recent research in Greenland. If not, there is no time like the present.
AUGUST 2011
Update on Research
In this post, I discuss some of the science behind my early research into Greenland’s clouds. Several months later, I shifted my focus entirely towards precipitation, which was ultimately the topic of my master’s thesis.
Click to expand this post
Research for me this summer has been going quite slow, mostly because I have had so many trips and visitors that it is actually hard to get up a real “head-of-steam.” I spent about a week’s time preparing for my Greenland trip, 11 days actually in Greenland, another 11 days road-tripping around the Southwest USA, about a week or so with my parents, and another few days with a visiting buddy. Now that summer is quieting down, school is starting. Though I will only be taking four credits this semester, I will also be preparing for the Comprehensive Exam, a brutal test that covers all the atmospheric science classes I took during my first year of study. What fun!
At NOAA, I have my toes dipped in a bunch of different topics and it seems that everyday brings a new task. I don’t have a well defined overall path yet; that will come with time I presume. I am only limited by what I wish to accomplish. There is so many potential aspects it is hard to narrow it down even slightly. I thought I would take this time to delve into some of the work I have been doing over the last six plus months, hopefully without going into any extreme detail and technical jargon that would surely bore even the most attentive individual to sleep. I can’t promise anything, however!
As I may have previously mentioned, our slew of instruments located in Greenland all have their eyes to the sky looking at clouds, each in a slightly different way. The first step was writing the computer code to be able to visualize the data for each instrument. Shown below is an entire days worth of data, in a pretty form. All the instruments from this plot basically look straight up from the ground, send out a signal of sorts, and measure how much of the signal is ‘reflected’ back. The instruments all send out signals of different wavelengths, causing the return signals to be unique for reasons I will not discuss. The more clouds and precipitation that is in the sky, the more that is reflected back. The top panel shows the reflectivity from the Milli-Meter wave Cloud Radar (MMCR). This is similar to a radar image you see on the news broadcasts, except it is the vertical reflectivity varying in time and is specifically designed to see clouds, not precipitation. Like all radars, this instrument emits microwaves.
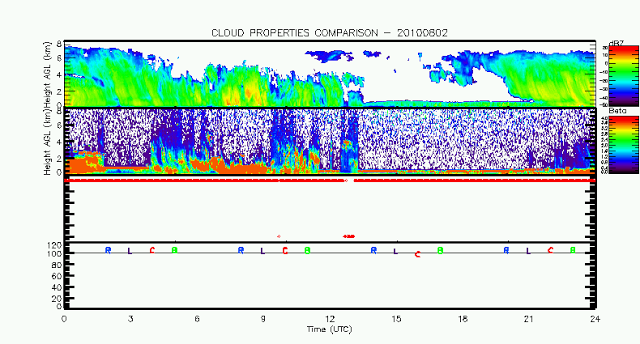
A days worth of cloud data from some of our instruments at Summit. It was very cloudy this day, as it is most days!
The 2nd panel down shows the backscatter from the Micro-Pulse Lidar. This instrument emits a green light beam and measures the reflected radiation. Unlike the radar’s microwaves however, this green light is quickly attenuated in liquid water. This is most apparent after 19:00 where the thick ice cloud above a thin liquid cloud layer is not seen by the MPL. The 3rd panel down shows the Ceilometer. This instrument is similar, but not as useful as the MPL. All that is plotted is whether the algorithm from the manufacturer’s software detected a cloud or not — red dot at the bottom for no cloud and at the top for a cloud.
One of my first tasks was to use these different instruments individually to determine how often it is cloudy at Summit; this is known as cloud occurrence, and is just given as a a fraction of time. The bottom plot sums up all the data in a useful way, showing the cloud occurrence for each 6-hour chunk of the day for each instrument (R = radar, L = lidar, C = ceilometer, B = best estimate from all instruments). As you can see, there is good agreement among all the instruments that it was nearly 100% cloudy the entire day.
While the previous plot is a great way to visualize all the data, it is not truly that useful by itself. If you combine all of the data for each month, you can determine monthly cloud occurrence fractions, which is a lot more useful. These values can be used to validate cloud occurrences that are spit directly out of climate model simulations. The plot below shows the same kind of data, but for each month individually since our project started in May of 2010.
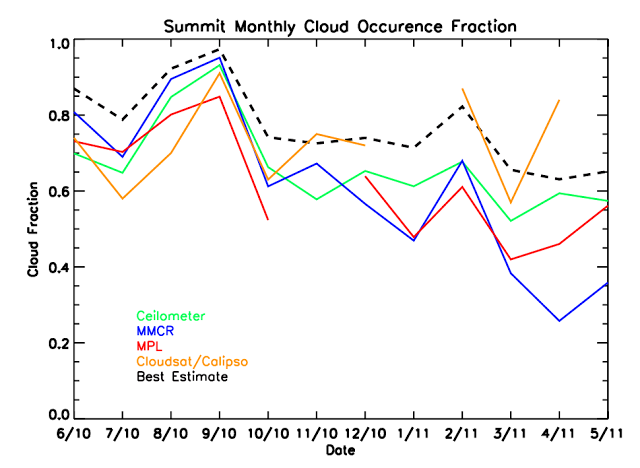
Figure shows monthly cloud occurrence fraction from our instruments at Summit for all months.
The instruments seem to agree fairly well in the beginning, but due to some mechanical failures in the winter likely caused by the extremely cold temperatures, the instruments begin to see a different picture of the clouds post-winter.

Figure shows a week’s worth of CloudSat overpass tracks in Greenland. Notice the frequency increases as you go northward. Several times CloudSat made very close approaches to Summit.
You may also notice the addition of an orange line, representing the cloud occurrence calculated from the space-based NASA CloudSat and Calipso data set. This brings me to my next area of research — using CloudSat data in conjunction with our ground-based data. CloudSat makes approximately 14 orbits around the Earth each day, passing over Greenland nearly every time. CloudSat’s radar is very similar to our radar, except it is looking down on the clouds, not up at them. The figure to right shows one week of CloudSat orbital overpasses. CloudSat has all of Greenland pretty much covered (with the exception of the far north, where it never overpasses), and the overpass frequency increases to the north. Using this same data for extended periods of time allows again for the calculation of cloud occurrence, except in this case for the entire Greenland continent.
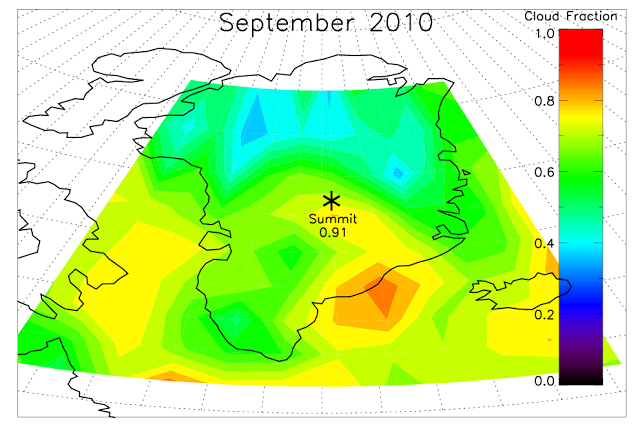
Figure shows the cloud occurrence fraction for all of Greenland for September 2010 derived from CloudSat data.
Shown above is Greenland’s cloud occurrence for September 2010 as seen by CloudSat; if you recall from the second figure, this was the cloudiest month at Summit that we have recorded. This map also shows a large cloud gradient over Greenland — i.e. it is very cloudy to south, but significantly less cloudy to the north. This kind of data is particularly useful because climate models cannot accurately represent clouds over the Greenland Ice Sheet, mostly because there are so few observations to improve the models. Having data like CloudSat’s that covers a good portion of the Arctic is a good first step to helping to improve the models. However, before this can be done, it must be shown that the CloudSat data is valid for the Arctic in the first place. This is one of my current tasks at this time — comparing what CloudSat sees while overpassing Summit to what our instruments, especially the MMCR, see from the ground.
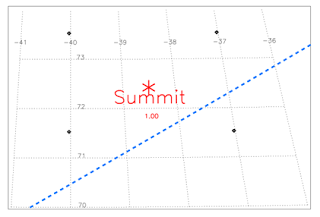
Image showing the track of CloudSat during a particular overpass where it passed within only 50 miles of Summit.
CloudSat makes a close pass (within about 50 miles) over Summit approximately once every two days. Shown here is an overpass from 11/28/10, where CloudSat passed appoximately 50 miles to the southeast of Summit. At the time of the overpass (approximately 6:00 UTC), there was a rather deep convective ice cloud over Summit (see red vertical line on figure below, in the top panel), extending up to 8 kilometers above the surface.
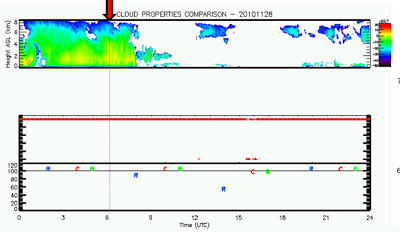
Figure for 11/28/10 showing all instruments data for the day. The red line indicates the time when CloudSat made it’s overpass, just after 6 UTC. The 2nd panel down is blank because the MPL was broke on this day.
Here I have a zoomed-in look at what both of the instruments saw for this overpass. The left panel just hows the average reflectivity at each high above the ground. The two compare fairly well, generally much less than a 5 dBZ difference through the entire cloud. The middle and right panels just show raw reflectivity data for the upward-looking MMCR and the downward-looking CloudSat radars. Again, a striking similarity. Reflectivity values, patterns, and cloud boundaries are nearly identical. This similarity, however, is not usually the case. Because Cloudsat almost never directly overpasses Summit, the two instruments are truly never actually measuring the exact same cloud at the exact same time, making this comparison quite difficult knowing their are inherent errors in the best possible method beforehand. For the best comparison, there needs to be a rather large cloud, that does not vary much in time or in space, which does not happen too often. Even the most featureless, unchanging dreary stratus cloud has rapidly shifting features that aren’t necessarily detectable to the naked eye. This is the quagmire that I currently am in. I have been reading through other’s work for the best method to do this comparison. For now, I don’t quite have the answer.
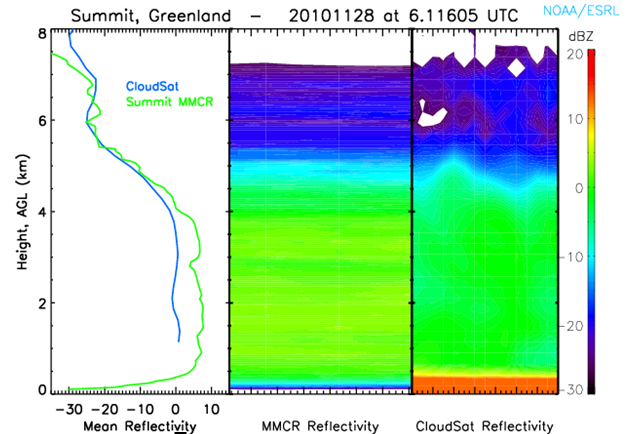
Figure shows the reflectivity comparison of CloudSat and our ground-based MMCR for this overpass.
—
Congratulations! That is, if you made it through this post without sleeping or becoming extremely lost. Hopefully now you have a better understanding of what us grad students go through on a daily basis. Some days it is challenging to continue to pursue a goal that you are not even sure quite what it is. It is strange to know in the morning that you actually have no idea what will be accomplished in a given day’s work. Sometimes you a accomplish what seems like a month’s worth of progress, while other days it seems like you actually took five steps back. Regardless, I will find my footing eventually and contribute in a significant way to the Arctic research community. Heck, that is what being a grad student is all about…finding a tiny little granule of knowledge about a given topic your interested in, researching it, and then expanding into 100-pages of non-sense for your thesis!
WARNING: All figures presented in this post are the property of NOAA/ESRL. Any reproduction or other use without expressed written consent is prohibited.
Click to collapse this post
DECEMBER 2011
Preparing for Polar Winter
In this post, I discuss the training required in order to travel to central Greenland in the middle of winter.
Click to expand this post
After spending some much needed time with family and old friends in Pennsylvania for Thanksgiving, I returned to Boulder for a very busy month of December. Upon returning, there was only one week left in classes, or class as I should say as I only had one. I gave a presentation, began and completed a 25-page paper on my Greenland research, and took the final exam by December 9th. It would seem after all that class work I deserved a much needed few days off.
This was not the case! The very next day I began a 10-day long wilderness medical training course in preparation for my departure to Greenland. This course, which was being offered at the University of Northern Colorado in Greeley, was extremely intensive and exhausting. A typical day for me involved waking up at around 5:30am, getting ready, leaving at around 6:30 and arriving in Greeley promptly for the start of class at 8:00am. Most days were split into two four-hour learning sessions separated by a lunch break. After class, which ran to about 5:30pm, I would take the hour-long drive home, at which point I would get a quick bite to eat and do homework for the course. A typical night’s homework involved a small exercise which usually took thirty minutes as well as reading about five chapters from the book. By the time I finished all that it was about 10:00pm and I was ready for bed! In addition, two of the ten days involved evening sessions which ran from 6:30pm to near midnight!
The main focus of the training was to give me the knowledge to provide medical care to anyone in a wilderness setting. This is much different than typical urban situations that EMTs train for. In the wild, you need to improvise much more and there is not as much medical treatment being done. Our training was mostly about identifying the problem, stabilizing the patient, and then evacuating them as appropriately as necessary, all the while remembering as many annoying acronyms as possible…I’m talking about you ABCDE2, LOR, RICE, LAF, CPR, HAPE, AMS, HACE, NOLS, WFR, SAMPLE!
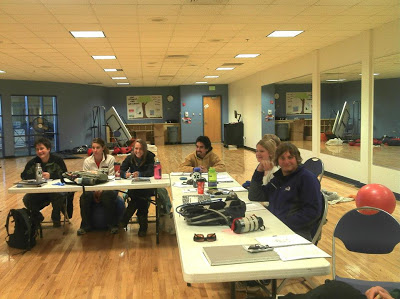
The classroom. It was actually a dance studio with tables and chairs added. Look how much fun were all having…!
About half of the class revolved around typical classroom chalkboard learning. The other half involved hands-on experiential learning, where the instructors would demonstrate something and then we would practice on each other. Some examples include making make-shift splints for fractured bones, CPR, giving injections, taking blood pressure, realigning broken bones, wrapping sprained ankles, pressure bandaging for wounds, administering butterfly bandages for lacerations, and much more. They would typically split the class up into two groups, one would be acting patients and the other would be rescuers. They would take the patients outside, give them some problem, then send the rescuers out to diagnose the problem and deal with it. It was great fun! You never knew what to expect when you were rescuing. The instructors routinely used copious amounts of fake blood and stage makeup to realify the scenes which was awesome! The class had about 20 students in it. Seemingly there was no one there similar to my age. They were either 18/19 years old or over 30. There was no other graduate students. Most people were taking the course because they teach youth outdoor camping groups, were ski-patrol, or were some kind of national park or state park rangers.
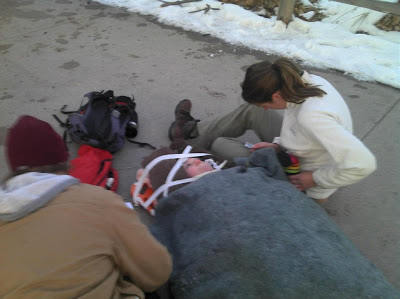
I am rescuing a girl from a hot-air balloon crash that had a spinal injury. We had taken care of a cut on her head, secured her neck with a cervical collar, put her in a sleeping bag for warmth (it really was cold out!), strapped her to a backboard to immobilize her spine, secured her head with padding and tape, moved her to this spot for evacuation via helicopter, and covered her with a blanket. At this point the girl on the right and I are monitoring her vital signs (Heart rate, respiratory rate, BP, and level of responsiveness in her brain, etc..) to make sure she is stable until the chopper arrives.
Overall, this training was a great learning experience. While I hope I never actually have to use this information, it is a great tool-set to have in your back pocket, especially since I spend a significant amount of time in Colorado’s wilderness. I feel like I would know what to do given most circumstances I could possibly come across out there. Soon a card will be arriving in the mail containing my certification for being a Wilderness First Responder (WFR, or “Woofer” as it is called) as well as standard CPR certification.
Other than this required training course, I have been busy trying to get medical and dental forms completed to be submitted for evaluation. These forms are very exhaustive and go way beyond the typical physical forms. They really want to make sure you are a completely healthy individual before they send you to an extremely remote location in Greenland in the middle of polar winter, where potential hospitalization and modern medicine could be days or weeks away. These are almost completed and it will be a huge weight off my shoulders when I send them away to the National Science Foundation.
I got my plane ticket for my the trip to Greenland already. I am leaving the states on January 30th and heading to Reykjavik, the capital city of Iceland, where I will spend a undetermined number of days (at least three) before continuing on via Twin Otter (small versatile aircraft) to Summit when the weather is clear. The three full-days prior to deployment (Jan 27-29), I will be attending some Greenland specific winter training in Denver with Polar Field Services (contracted company that runs Greenland NSF research). I am not exactly sure what this entails, but it should definitely give more insight into how to deal with the extreme conditions Summit is sure to offer! Just last week the temperature dipped below -70 degrees F! Currently it is a balmy -56 F (CLICK HERE TO CURRENT CONDITIONS)! I still haven’t grasped truly how cold it is going to be, as readings near zero in Boulder have been feeling mighty chilly to me lately!
Click to collapse this post
FEBRUARY 2012
The Land of Fire and Ice
Here I write about my experience traveling to Greenland for the second time, passing through the Iceland on the way there.
Click to expand this post
Unlike trips to Greenland during the summer which involve flights on C-130’s via the U.S. Air National Guard, trips to Greenland in the winter are routed through Iceland or Denmark, with the final flight to Summit being a chartered (super expensive and private) one. This year I was routed through Iceland, which I was definitely more interested in seeing than Denmark. The country gets its rather paradoxical nickname from the fact that even though volcanoes created the island and are still active, it is located far north and is covered with many glaciers and sees significant snowfall each winter!
After getting all my luggage for three months packed, which by the way was about 120 pounds of stuff jammed into 2 giant body bags, a small suitcase, and a backpack, I boarded a plane and headed for Iceland via Icelandair. Total flight time was around 13 hours, not including a 2-hour lay-over in Seattle, and a time change from Colorado of seven hours. We arrived in Reykjavik, the capital city of Iceland, which is home to roughly two-thirds of the entire country’s population of 300,000! When we were getting off the plane the attendants were handing out free ponchos which struck me as pretty odd..more on this later! Our cab driver from the airport to the downtown said just three days prior Reykjavik received its biggest snowfall in 40 years, though he never actually divulged how much that was. Since then, it had been copiously raining, and most of the record snow was reduced to thick ice. This made traversing the streets of the city quite a challenge! We had about seven hours to kill in Reykjavik before our domestic flight to another city in Iceland. We walked around, stopping at a coffee shop, some souvenir stores, and finally an opera house.
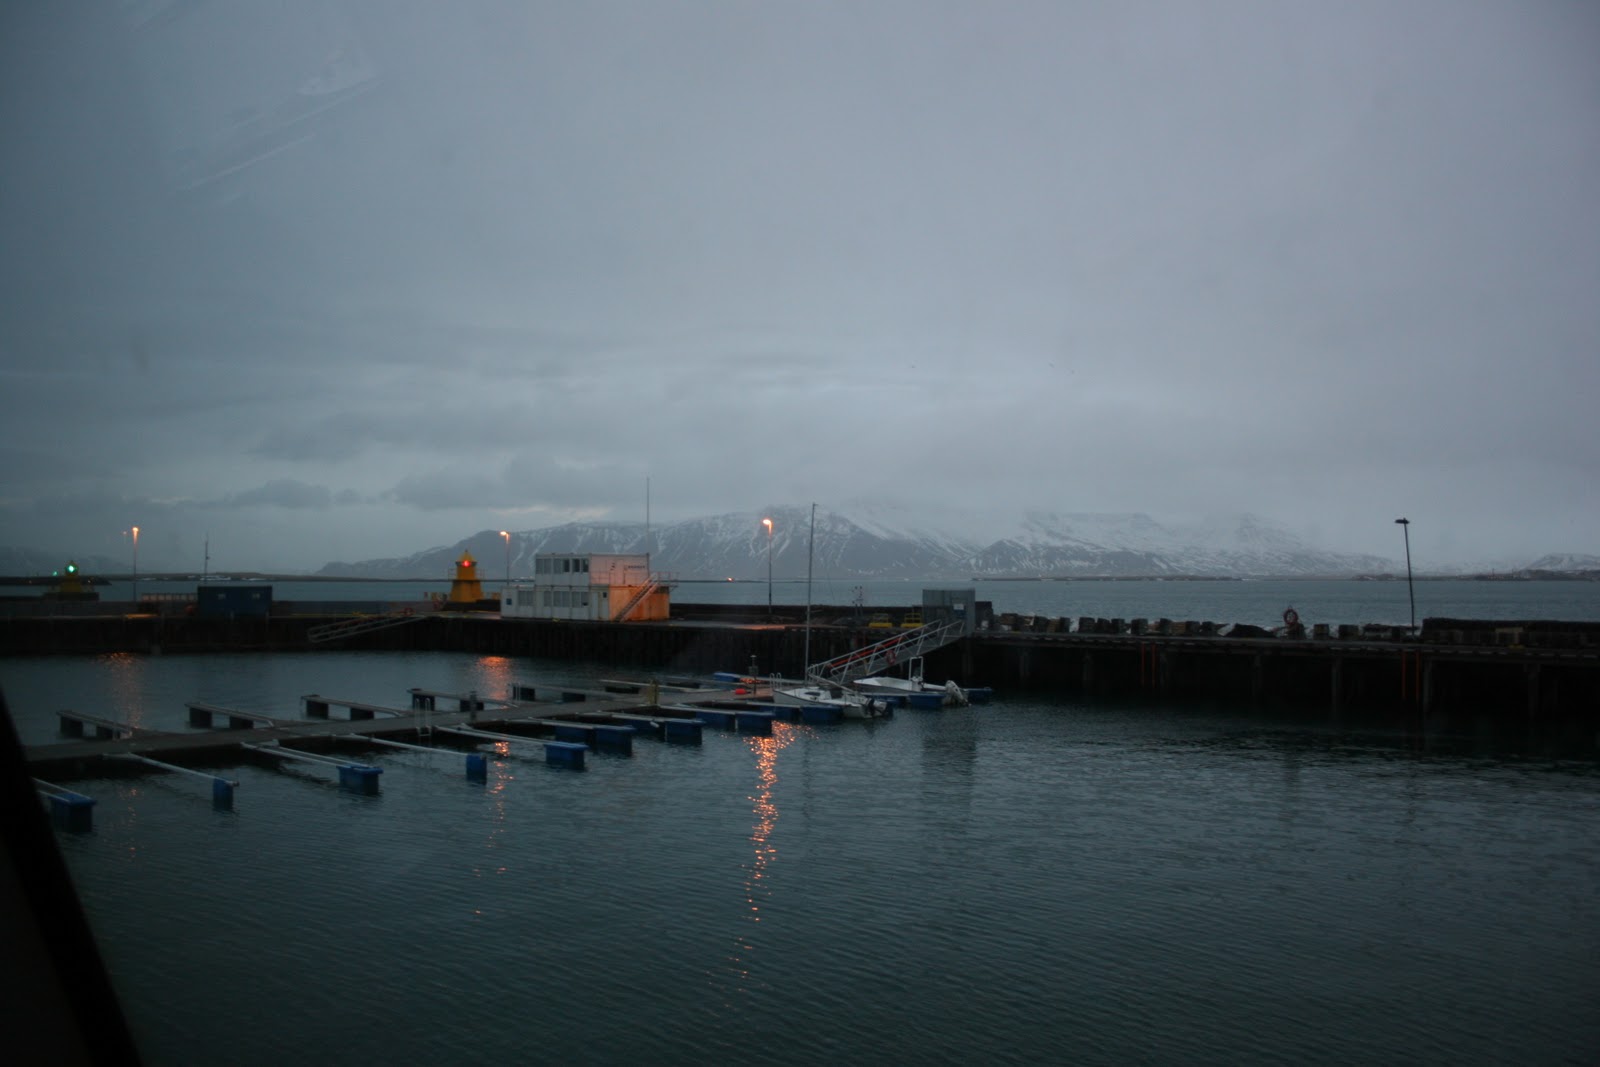
The harbor in Reykjavik, as seen from inside the opera house.
By the time we were ready to leave to catch our next flight, it had begun to heavily rain and was very windy. Now the free ponchos at the airport were beginning to make sense! Iceland is located in a place that is very favorable for frequent rain and mountain snow storms, similar to the Pacific Northwest in the United States. After getting the ponchos on, which were of fairly high quality, we ran as fast as humanly possible on a sheet of ice to the domestic airport. It was quite a task to keep the hood of the poncho up with the wind. The one lady we were with got so turned around when her hood blew over her head, she tripped and stumbled into a small eight-inch deep fish pond. It was pretty hilarious, though she didn’t even care as everyone was already soaked.
We made it to the airport and had plenty of time to change clothes and dry off. This flight was only from the capital city to a smaller city called Akureyri, which was located along a fjord near the northern shore of the island, less than a one-hour flight away. The security was non-existent at this airport, which was shocking to me coming from the United States. All of us thought for sure the flight would be delayed as it was extremely windy and a complete downpour. To our surprise, the flight left as planned and the take-off couldn’t have been smoother!

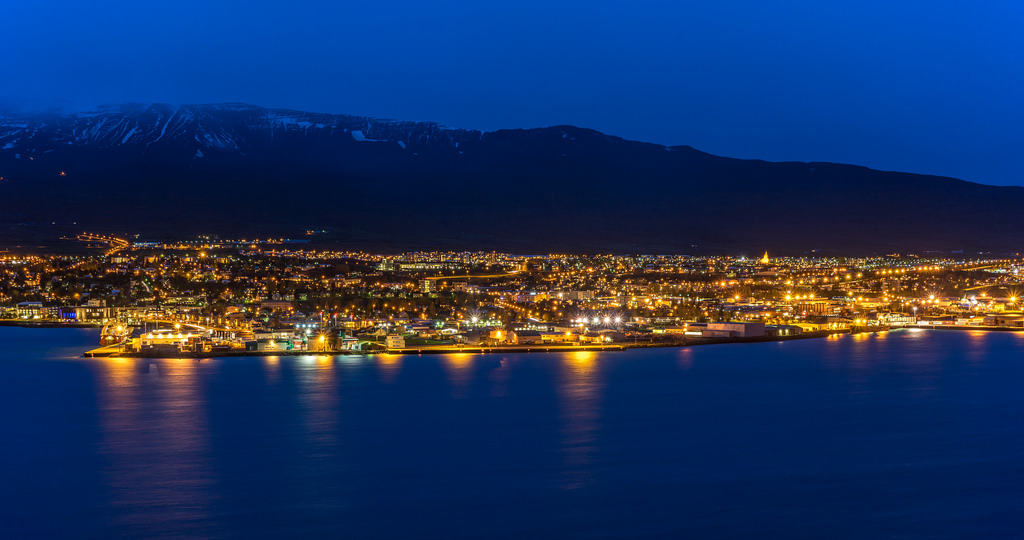
A good shot of Akureyri looking down from a part of town on top of a hill! Cute little port town!
We arrived in Akureyri at around 3pm local time. Because Iceland is located so far north, at around 65 degrees latitude, it only sees about 5 hours of light per day. Iceland actually uses the same time zone as England, even though it is significant further west.This means that instead of the daylight being centered on the middle of the day, it is skewed away from local noon. The sun actually rose at around noon local time and set at 5pm, a consequence of choosing the observe the same time as England.
The town itself is home to around 20,000 residents, most of them associated with the thriving fishing industry of the region. Akureyri is surrounded by chains of huge snowy volcanoes, some active, some dormant. It was not until the next afternoon you could really see them because of low clouds and rain. This area is one of the coldest on the island, but just like Reykjavik had streets and sidewalks covered in inches of ice! However, there were noticeably more massive snow piles and more actual snow on the ground. 100% of the town is heated geothermally, a form of green energy capitalizing on the energy of near-surface magma pools, which I learned from a local. It turns out most Icelanders actually speak good English, in addition to their first language, Icelandic. In the summer time, this small town is a major tourist attraction. The weather is much nicer, and just like coastal Greenland, the treeless mountainsides turn a beautiful green hue!

Main street Akureyri
Our hotel was quite fancy, not five stars or anything, but maybe four. It was located right at the end of the main strip of town. It was fun walking around exploring the narrow streets and cute European neighborhoods. Apparent they have a different type of Christmas in Icleland, which lasts much longer than one day, so most of the town was still outfitted with Santa decorations and Christmas lights!
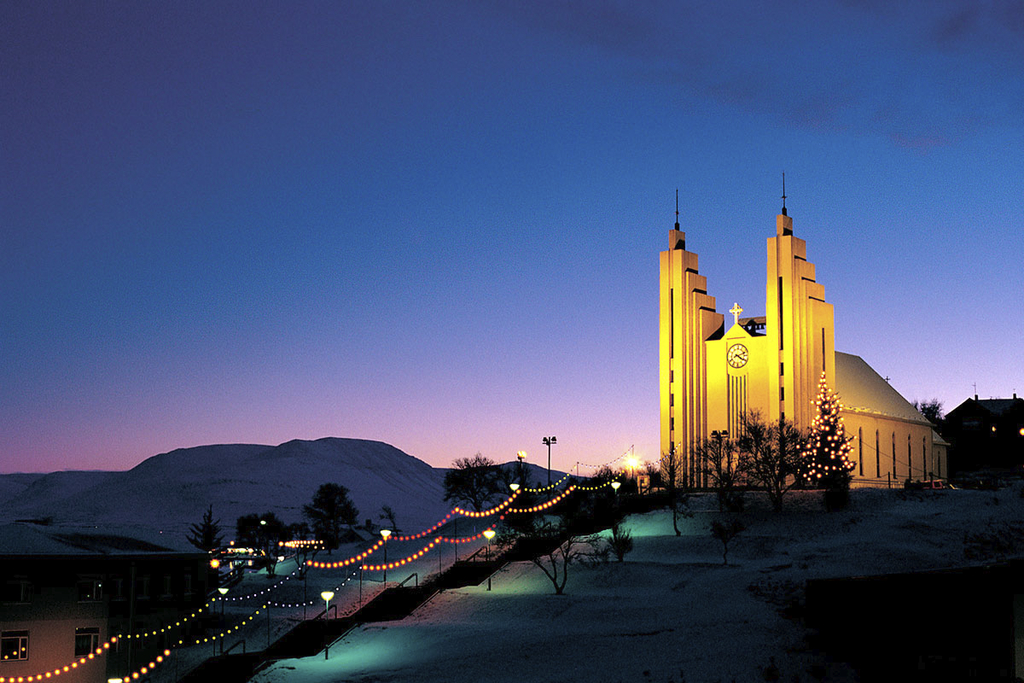
The most prominent structure in town was a hilltop church.
Because the weather was so gloomy and I didn’t get to truly explore the outdoors, my favorite part about my time in Iceland was definitely the food. I love trying local cuisine, especially ones that you cannot get, at least easily, in America. We all went out for dinner twice in Akureyri. The first night I ordered a reindeer burger! I thought it was odd at first, but they put blackberry jam on their burgers, as American’s would put ketchup. Though it sounds slightly gross, it was very delicious! The reindeer tasted very similar to white-tail deer, and actually to beef for that matter. We also ordered a dozen puffin legs, six of which I downed myself. I know it is cliche, but they tasted like chicken legs, except they were a little smaller. The next night we went to a seafood restaurant…and I do love seafood. There were several interesting choices, but I ended up choosing whale steak. Commercial fishing of whales is highly controversial worldwide, and in the United States it is illegal to sell, serve, eat, or even have almost all whale products. I am not ashamed to admit I have tried whale, and even less ashamed to say it was delectable. I was served two hearty steaks, with an interesting sauce on them that was sweet. They texture and look reminded me much of a rare beef steak. It did not have much of a fishy taste, but was a bit oily, as I have heard previously. I still prefer beef, but if I ever had the chance to order whale again, I would definitely do it! These Icelandic foods will have to hold me over until I get to coastal Greenland when returning home in April, where musk ox is the staple of their diet!
A final look at Akureyri as we left in the Twin Otter for Summit.
All I know is that I sure could get used to these free trips to random places as Iceland was a great experience! Preferably I would like to return in the summer, when exploring the magnificent volcanic landscape would be possible. Though, after spending a few days in this country, I am going to petition to change its nickname from the “Land of Fire and Ice” to the “Land of Wind and Rain!”
We got our final flight, which would take us to Summit from the same airport where we arrived to Akureyri. This time we were chartering a tiny, versatile aircraft known as a Twin Otter. These planes are famous for flying to very remote locations, especially in the Arctic and Antarctic, and likely the only plane that could land at a Summit during this time of year! With all of us aboard the eight-seated Twin Otter, reluctantly sharing the cabin with a 500-gallon fuel tank, we took off for Summit, anxious to finally get to our destination atop of the Greenland Ice Sheet!
Click to collapse this post
.
Check back next Friday for the third and final post in the Life Below Zero series. Have a good weekend!
Read “Life Below Zero: Part III” HERE
.


You must be logged in to post a comment.