One thing that should be clear after this week’s lack-luster winter storm: a couple of degrees and 25 miles can make a world of difference. While Boulder received just a few wet snowflakes, portions of southern Denver piled up more than a foot of snow. We explain why the situation north of Denver didn’t play out as forecasters were suggesting.
First off, despite the extreme media hype, let’s remember that historic snow and blizzard conditions were NEVER expected in Boulder. The low pressure and best upper-level dynamics associated with the system were to remain well to our south. If those were your expectations, you were setting yourself up for disappointment, right from the start. Of course, it surely didn’t help that some media was forecasting snow totals over 6″, and in some cases, like our local NWS office, up to 14″ for the Plains of Boulder County. In reality, Boulderites should have been ready for the first “real” snow of the year, and not much more. We put out our final forecast at 6pm Monday evening, calling for 3-7″ for the city, with less snow to the north, and more to the south. We also mentioned that there was a larger-than-normal chance for the forecast to bust, either way. Our final forecast map is shown below.
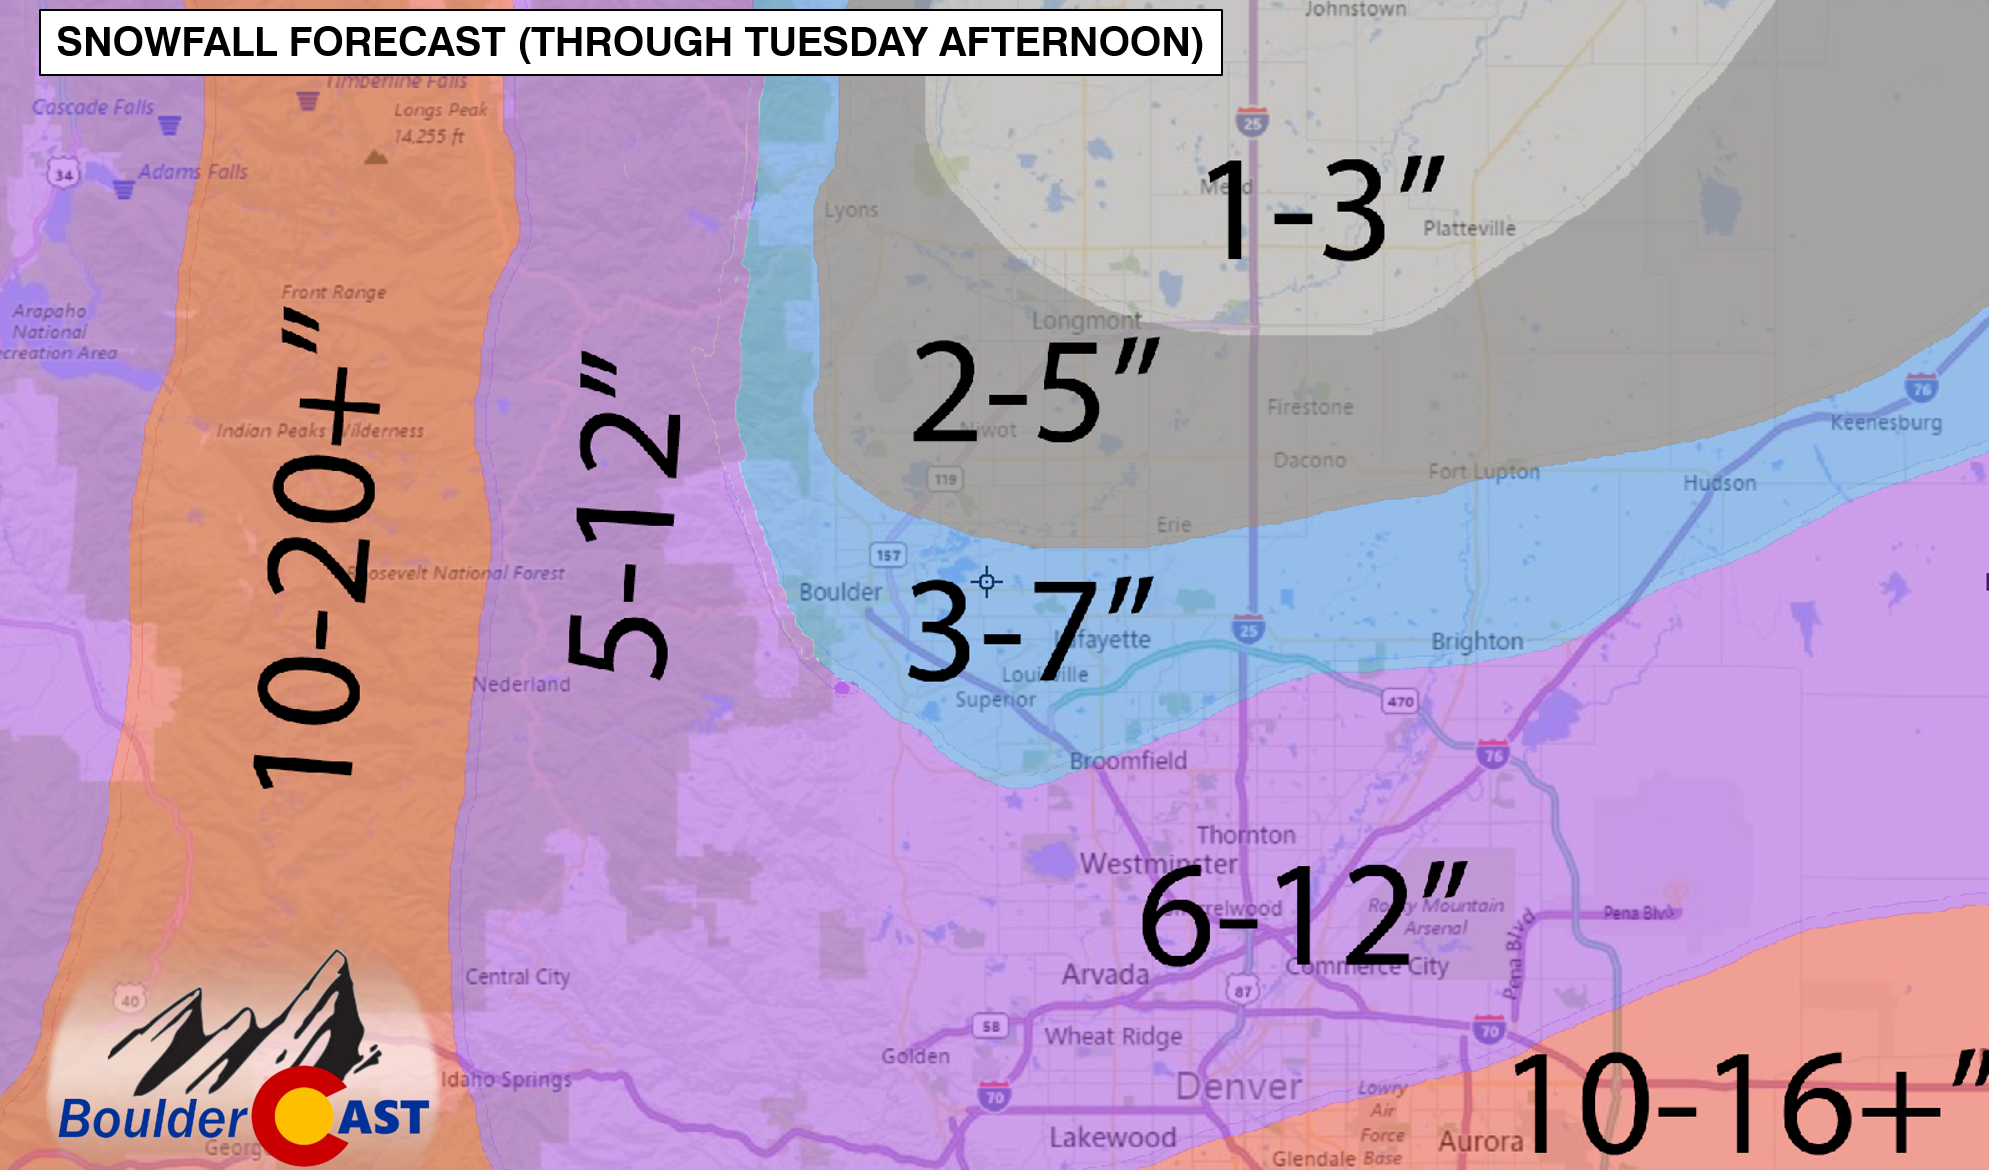
BoulderCAST forecast snow totals for the November 16-17 event.
A TALE OF NO SNOW
The event began as expected, with a shield of precipitation moving northward through the Denver Metro area, quickly changing over to snow in the southern suburbs during the afternoon on Monday. Precipitation began as rain in Boulder around 5pm and took a full five hours until snow began to finally mix in, just before the precipitation concluded. Much of the region was battling a pool of low-level “warm” air, which just would not cool down. Check out the time series of data from the BoulderCAST weather station below, following along with the discussion thereafter.
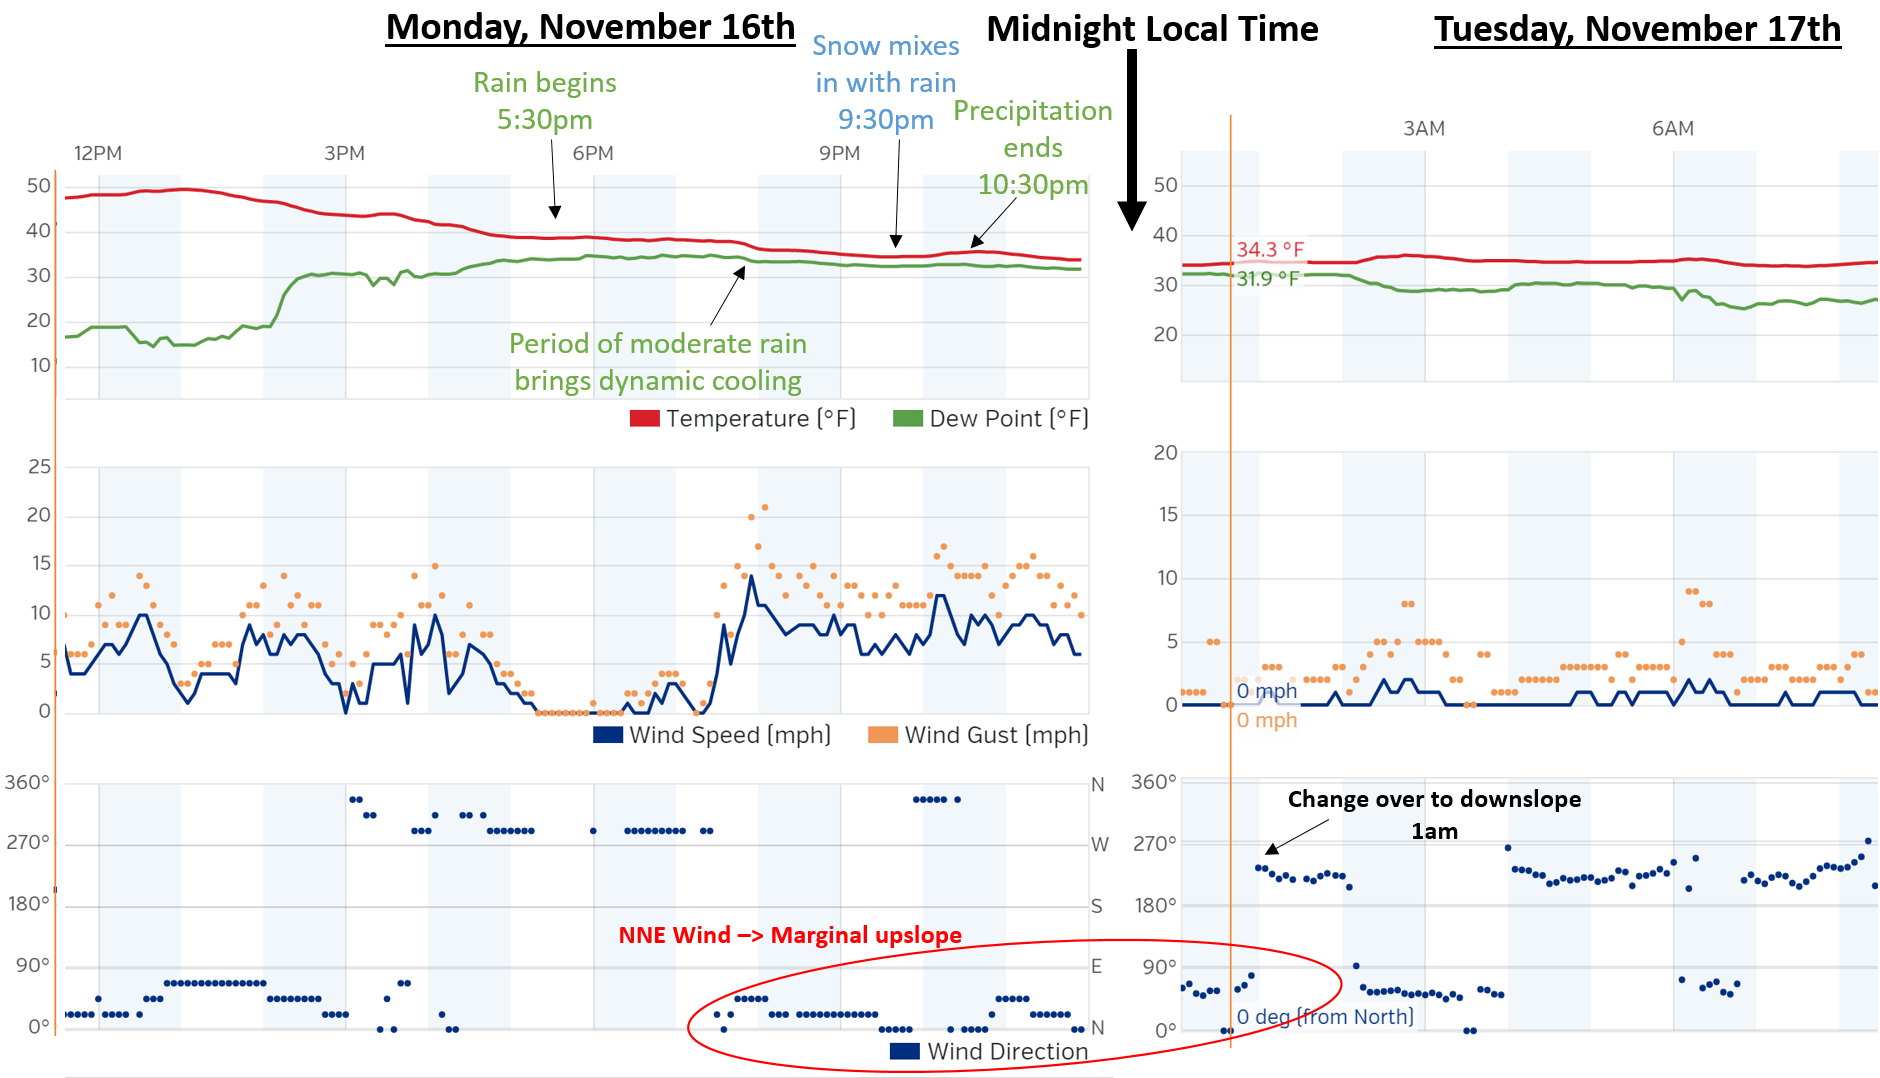
The surface temperature hovered around 34 or 35 degrees for the duration of the precipitation and overnight. There wasn’t much low-level cold air around, so despite the light north-easterly upslope flow, there was essentially no cold air advection. Without this, evaporative cooling is the next best method to reduce the temperature of the air. However, we had already reached the saturation point (temperature equal to the dew point). Remember, temperature cannot drop below the dew point, so evaporative cooling was not an option. One final method is dynamic cooling, which is caused by vertical motion (pressure decrease) and often accompanies precipitation. We see this happen around 7:45 pm on the plot, both temperature AND dew point drop in tandem during a brief period of moderate rain (a signature of dynamic cooling). However, it didn’t last nearly long enough to get the temperature down to allow snow to fall and ultimately accumulate. This dynamic cooling likely played a major role in the cool down for the parts of the Metro area that had more snow, like south Denver.
18″ of snow fell in Elizabeth, a small town located on the Palmer Divide at 6,500 feet elevation (just SE of Denver)
The upslope component to our surface wind was also quite weak. We see in the plot above, the wind direction was close to 0 degrees (straight north) during the precipitation (circled in red). This direction is not very favorable for precipitation in Boulder, as that wind is blowing mostly parallel to the mountains, not straight into them. We even see a shift to downslope around 1am at the surface (225 degree wind direction), which all but killed our chances of further precipitation.
Though we don’t have observations, it is likely the downslope component over Boulder was present from the onset of the storm just above the surface, significantly limiting our precipitation. This downslope likely also counteracted the cooling and was a major player in keeping our temperatures too warm just above the surface. We knew that downslope would be the limiting factor for Boulder, be we, nor anyone, saw it having that big of an impact.
Another indicator that the models were out to lunch is evident in Tuesday’s afternoon high. Instead of temperatures topping out in the upper 30’s like the models suggested, Boulder warmed up to 53 degrees. Fifteen degrees of forecast error for very next day is extremely rare. While it could be argued that the lack of fresh snow on the ground contributed to the warmer temperatures (less latent heat flux / lower surface albedo), it’s almost as if they truly overestimated the cold content of the entire air mass in general. Both sunny skies and downslope conditions were in the forecast for Tuesday afternoon, just not the quick rebound back into the 50’s.
WHY DID IT HAPPEN?
We showed you the observations of what actually happened. From that, we postulated factors that likely contributed to those observations. But why was this not foreseen by the models?
Well, most notably, the storm system ended up tracking slightly further south than ALL of the models predicted, even the ones suggesting lower snow totals to begin with, like the NAM and Euro. Seen below, early Tuesday morning, the models projected the 500 mb low to be centered very near to the point where Colorado, Kansas, and Oklahoma intersect. However, observations show that the low tracked about 25 to 40 miles further south, through the Texas panhandle.
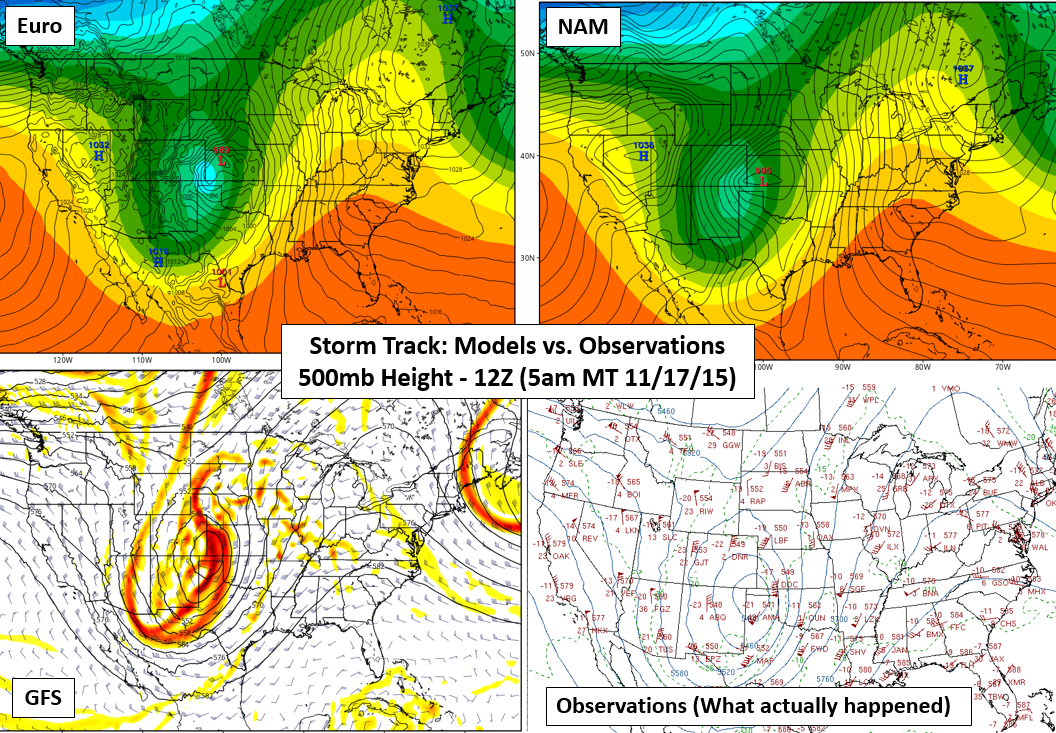
The models were about 25 to 40 miles off on the storm track at 500 mb.
The disparity at 700 mb is even more significant, upwards of 150 miles in the GFS!
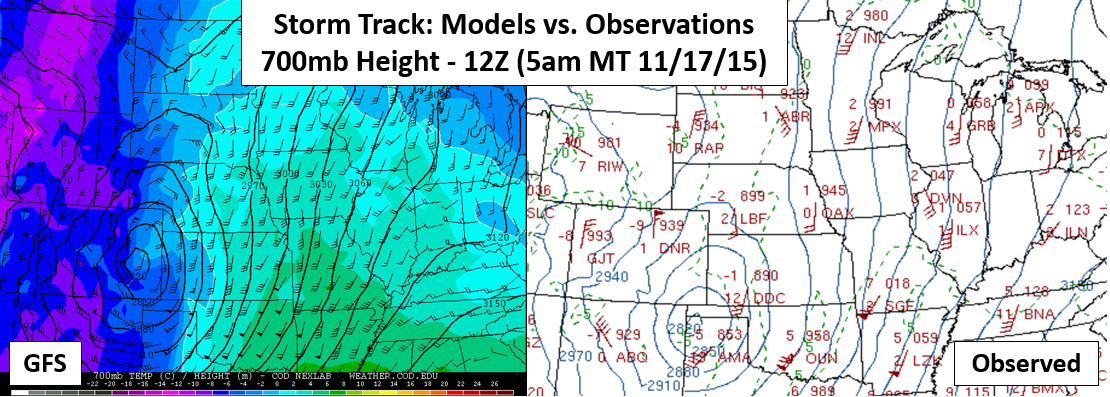
The GFS was off by ~150 miles in the position of the 700 mb low on Tuesday morning
The shift is subtle, but the impact was exacerbated by the nature of the system and Boulder’s location. There was expected to be a very tight gradient in north-south snowfall totals, from Boulder southward through Denver. This ever-so-slight shift in storm track moved the bulls-eye of precipitation southward, and ushered in more downslope to Boulder. Imagine taking our forecast map and moving everything down 25 miles. Surely, less folks would have been disappointed come Tuesday morning (or happy, depending on your sentiment towards the white stuff)!
TO SUMMARIZE:
- The storm tracked a bit further south than expected. Because of the tight gradient in snow totals, this shifted Boulder from a marginally favorable location, to an unfavorable spot for much precipitation to occur. This is because it altered the wind direction to lose most of the upslope component, and because we were further from the core of the low. The heaviest (and almost all) precipitation remained to our south.
- Temperatures in Boulder (and much of northwest Denver area) were too warm. This was likely the result of the adjusted wind pattern from the storm track producing more downslope (warming) just above the surface. The lack of much precipitation for us also limited dynamic cooling. As a result, the precipitation we did get fell as a cold rain, instead of snow. These warm temperatures during a November storm are not at all typical, and may be a topic of future discussion.
THE NUMBERS
The map below shows measured snowfall totals across the region, overlayed onto our forecast map. Those totals in green were within our forecast range (+/- 1″), while those in red were not. In general, most areas were a bust. The warm air wasn’t just an issue for Boulder. Rain cut into snow totals for much of the Metro area. Downtown Denver, for example, had more than a half inch of rain before it finally changed over to snow. The few bright spots were the Foothills immediately west of Denver and the area near Lyons. Lots of green there!

Forecast snow (background colored contours) and observed snow totals (boxes). Green boxes indicate observations that fell within one inch of the forecast, while red fell outside this threshold.
Boulder officially recorded 0.1″ of snow from the event, which is clearly less than our forecasted 3-7″. However, we are happy with our forecast. With such disparity in the models, even in the very last round of runs before the storm arrived, weather forecasters have to play it safe. It is better to prepare for the worst, than to be caught off guard entirely. If it is any consolation, Boulder did receive 0.3″ of rainfall. If it had been cold enough for snow, it would have added up to 2 or 3 inches!
Well there you have it! Hopefully next time, Mother Nature doesn’t throw a wrench (or two) into the forecast. While we enjoy the challenge of forecasting such a sensational storm, we know it can be frustrating for the general public. Hang in there! The “big one” may already be on the way…
For a more detailed discussion on the challenges in forecasting this specific storm, check out Episode #18 of the BoulderCAST Podcast, which is appropriately titled A Tale of No Snow.
As always, be sure to subscribe to our posts and follow us on Facebook and Twitter for all the latest winter storm updates and forecasts.


You must be logged in to post a comment.